Order Flow Trading: How to Read What the Market Is Actually Doing
⚡ Key Takeaways
- Order flow trading analyzes actual buy and sell orders hitting the market rather than relying solely on price charts
- Tools like Bookmap and footprint charts visualize the order book, showing where large buyers and sellers are positioned
- Bid/ask imbalance reveals whether aggressive buyers or sellers are dominating, providing directional clues before price moves
- Absorption occurs when large resting orders absorb aggressive selling or buying without price moving, signaling potential reversals
- Order flow analysis can reveal institutional activity that is invisible on standard candlestick charts
What Is Order Flow Trading?
Order flow trading is a method of analyzing the actual orders being placed and executed in the market to make trading decisions. Instead of looking at candlestick patterns, moving averages, or other lagging indicators, order flow traders study the raw data of who is buying, who is selling, how aggressively, and at what price levels.
Every price movement is caused by an order. When a buyer places a market order, it hits the ask and pushes price up. When a seller places a market order, it hits the bid and pushes price down. Order flow analysis gives you visibility into this process as it happens, rather than after the fact when it appears as a candle on a chart.
Think of it this way: a candlestick chart shows you that a stock went from $100 to $102. Order flow shows you that 50,000 shares were aggressively bought at the ask, 3,000 shares were absorbed at $101 resistance, and a large institutional buyer placed a 20,000-share iceberg order at $100.50. The chart shows the result. Order flow shows the cause.
Reading Order Flow vs. Reading Charts
Chart-based trading is reactive. You see a pattern form, then act on it. The pattern is a summary of completed transactions. By the time a bullish engulfing candle prints, the buying that created it has already happened.
Order flow trading is proactive. You see aggressive buying building in real time before the candle completes. You can enter during the buying, not after it has concluded.
| Aspect | Chart-Based Trading | Order Flow Trading |
|---|---|---|
| Data source | Completed price bars | Live orders and executions |
| Timing | Lagging (after the move) | Leading (during/before the move) |
| Information depth | Price and volume | Price, volume, aggression, size, and resting orders |
| Learning curve | Moderate | Steep |
| Tools required | Standard charting | Specialized platforms |
| Best for | Swing/position trading | Day trading, scalping |
This does not mean charts are useless. Most order flow traders combine both approaches: charts for identifying key levels and context, order flow for precision entry and exit at those levels.
Essential Order Flow Tools
Bookmap
Bookmap is the gold standard for order flow visualization. It displays the full order book (limit orders at every price level) as a heat map overlaid on a price chart. Large resting orders appear as bright, thick lines. As orders are filled or pulled, the heat map updates in real time.
What Bookmap shows you:
- Liquidity pools: Where large limit orders are stacked, creating potential support and resistance
- Iceberg orders: Large orders broken into smaller visible pieces, detected by repeated fills at the same price
- Order book dynamics: How the bid and ask sides build and collapse as price approaches
- Trade execution: Every single trade, color-coded by aggression (hitting bid vs. lifting ask)
Footprint Charts
Footprint charts (also called volume-at-price or cluster charts) replace standard candlesticks with detailed volume data at each price level within the bar. Instead of seeing a green candle with 10,000 total volume, you see exactly how many contracts were bought at the ask and sold at the bid at every tick within that candle.
Common footprint formats:
- Bid x Ask footprint: Shows bid volume and ask volume side by side at each price
- Delta footprint: Shows the net difference (ask volume minus bid volume) at each price
- Volume profile footprint: Shows total volume at each price as horizontal bars
Level 2 / Market Depth
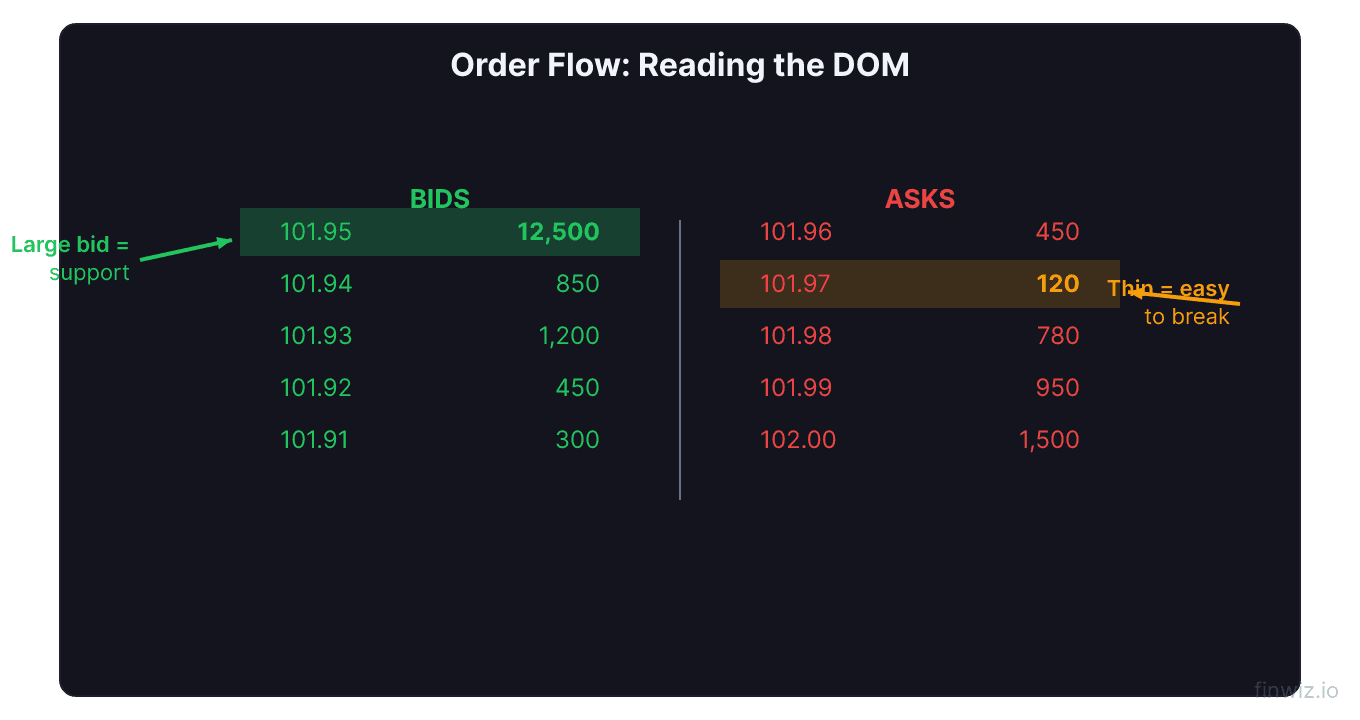
Level 2 (also called the order book or market depth) shows pending limit orders at every price level above and below the current price. The bid side shows buyers waiting; the ask side shows sellers waiting.
While Level 2 is available on most trading platforms for free, it has limitations. Orders can be placed and cancelled in milliseconds (spoofing), and large orders are often hidden as icebergs. Raw Level 2 data is noisy and requires experience to interpret.
Pro Tip
Bid/Ask Imbalance
Bid/ask imbalance is one of the most actionable order flow signals. It measures the ratio of aggressive buying (trades at the ask) to aggressive selling (trades at the bid) over a given period.
How to read it:
- Strong ask imbalance (3:1 or higher): For every 1 contract sold at the bid, 3 or more are bought at the ask. Buyers are dominating. Price is likely to move up.
- Strong bid imbalance (1:3 or lower): Sellers dominate. Price is likely to move down.
- Balanced (1:1 to 1.5:1): Neither side is in control. Price may chop sideways.
Stacked imbalance is even more powerful. This occurs when multiple consecutive price levels show the same directional imbalance. If five consecutive prices all show 3:1+ ask dominance, you have a strong demand zone.
Example on ES (S&P 500 Futures):
| Price Level | Bid Volume | Ask Volume | Ratio |
|---|---|---|---|
| 5,205 | 200 | 1,800 | 1:9 |
| 5,204 | 350 | 2,100 | 1:6 |
| 5,203 | 400 | 1,600 | 1:4 |
| 5,202 | 500 | 1,500 | 1:3 |
| 5,201 | 600 | 1,200 | 1:2 |
The stacked imbalance from 5,202 to 5,205 shows aggressive buying at every level. This is a demand zone that may act as support if price pulls back.
Absorption: The Hidden Reversal Signal
Absorption occurs when large resting limit orders at a specific price level absorb aggressive market orders without the price moving through that level. It is one of the most powerful signals in order flow analysis.
Bullish absorption example:
Price drops to $99.50. Heavy selling (market sell orders) hits the bid at $99.50. Normally, this selling would push price to $99.49, then $99.48, and so on. But at $99.50, a massive resting buy limit order absorbs all the selling. Despite 50,000 shares hitting the bid, price holds at $99.50.
This tells you a large buyer (likely institutional) is defending $99.50. If the selling pressure exhausts itself and the resting buyer still has size, the next move is likely up.
How to identify absorption:
- Price approaches a level with high selling/buying pressure
- Volume at that level is very high (much higher than surrounding levels)
- Price does not move through the level despite the volume
- Delta at that level is heavily negative (for bullish absorption) or positive (for bearish absorption), but price holds
Bearish absorption is the reverse: price rises to a level, heavy buying hits the ask, but price does not break through because a large seller is absorbing all the buying.
Institutional Tells in Order Flow
Institutional traders move large amounts of money and leave footprints in the order flow, even when they try to hide. Here is what to look for:
Iceberg Orders
Large orders broken into smaller visible pieces. If you see 100 shares repeatedly showing on the bid at the same price, getting filled, then immediately showing 100 again, this is an iceberg. The true order size could be 50,000+ shares. Bookmap detects these by tracking cumulative fills at a single price.
Sweep Orders
When an institution needs to buy a large number of shares quickly, they sweep multiple price levels simultaneously, hitting every ask from the current price up several levels. On the footprint chart, this appears as a large ask volume spike across multiple prices in a single moment. Sweeps indicate urgency and conviction.
Time and Sales Patterns
The time and sales (tape) shows every individual trade. Institutional activity often appears as:
- Repeated round-lot trades (1,000, 5,000, 10,000 shares) at the same price
- Trades consistently hitting the ask (accumulation) or bid (distribution) over a sustained period
- Sudden large block trades (50,000+ shares) that appear and execute in a single print
Building an Order Flow Trading Strategy
Step 1: Identify Key Levels
Use standard technical analysis to identify support, resistance, and VWAP. These are the levels where order flow analysis is most valuable because they are where large orders tend to cluster.
Step 2: Watch for Order Flow Confirmation
As price approaches a key level, switch to your order flow tools. Look for absorption, bid/ask imbalance, or iceberg orders that confirm or deny the level's strength.
Step 3: Enter Based on Flow, Not Price Alone
Instead of buying at support because "the chart says so," buy at support because you can see absorption, stacked bid imbalance, and iceberg buying defending the level. The chart gives you the location; order flow gives you the confirmation.
Step 4: Manage the Trade with Flow
Monitor order flow after entry. If you are long and aggressive selling resumes at higher prices, consider tightening your stop. If absorption appears at new support levels above your entry, you can hold with more confidence.
Limitations of Order Flow Trading
Not a crystal ball. Large orders can be placed and cancelled. What looks like institutional support at $100 can vanish in milliseconds if the order is pulled.
Speed advantage. High-frequency trading firms process order flow data in microseconds. By the time you see and react to a signal, the HFTs have already acted. Your edge is in reading larger patterns and context, not in raw speed.
Only works in liquid markets. Order flow analysis requires deep, active order books. Thin stocks have sparse order books where a single large order can dominate the tape and mislead. Stick to SPY, ES, NQ, QQQ, and high-volume stocks.
Steep learning curve. It takes months of screen time to develop pattern recognition for order flow. The data is dense and moves fast. Paper trade while learning, and focus on one market (like ES futures) until you develop competence.
Frequently Asked Questions
Do I need expensive software to trade order flow?
Not necessarily. ThinkorSwim offers Level 2 and time and sales for free. Sierra Chart ($26/month) offers footprint charts. Bookmap starts at $39/month. However, professional-level order flow analysis does benefit from dedicated tools. Start with what you have and upgrade as your skills develop.
Can I use order flow for stocks, or is it only for futures?
Order flow analysis works for both, but it is more effective in futures markets (ES, NQ, CL) because they have centralized order books. Stock order flow is fragmented across multiple exchanges and dark pools, so you only see a portion of the total flow. For stocks, combine order flow with tape reading techniques.
How long does it take to learn order flow trading?
Most traders need 3-6 months of consistent screen time to develop basic competency and 1-2 years to become proficient. Start by watching one instrument (like ES futures) for at least 30 minutes daily without trading. Focus on recognizing absorption and imbalance patterns before risking real money.
Is order flow better than technical analysis?
Neither is objectively "better." They complement each other. Technical analysis excels at identifying levels, trends, and patterns on higher timeframes. Order flow excels at timing entries and exits at those levels on lower timeframes. The most effective approach combines both.
What markets are best for order flow analysis?
S&P 500 E-mini futures (ES) is the most popular market for order flow traders. It has deep liquidity, tight spreads, a centralized order book, and moves in predictable patterns around key levels. Other good choices include Nasdaq futures (NQ), crude oil futures (CL), and Treasury bond futures (ZB).
Disclaimer
This is educational content, not financial advice. Trading involves risk, and you should consult a qualified financial advisor before making any investment decisions. Past performance does not guarantee future results.
Related Articles
12 chapters covering charts, indicators, risk management & more. Plus weekly trading insights.