Tape Reading & Time and Sales: Reading Order Flow in Real Time
⚡ Key Takeaways
- Tape reading involves analyzing the time and sales window to observe real-time order flow — every trade that executes, its size, price, and direction
- Block trades (large single prints of 10,000+ shares) often indicate institutional activity and can signal directional conviction
- The tape shows reality — what trades are actually happening — while the order book shows intent, making the tape the more reliable data source
- Mastering tape reading takes months of practice but provides an edge that is difficult for algorithms to replicate
What Is Tape Reading?
Tape reading is the practice of analyzing real-time trade executions — every buy and sell that occurs — to gauge the direction and intensity of order flow. The name comes from the old stock ticker tape machines that printed trade data on paper strips. Today, the "tape" refers to the time and sales (T&S) window on your trading platform, which displays every executed trade in real time.
While Level 2 quotes show you what orders are waiting to be filled (the order book), tape reading shows you what orders are actually being filled. This distinction is critical. The order book reveals intent — Level 2 shows what participants say they want to do. The tape reveals truth — it shows what is actually happening. Orders on Level 2 can be canceled, spoofed, or hidden. Trades on the tape are executed and final.
Tape reading is one of the oldest forms of market analysis, predating charts, indicators, and algorithms by over a century. Despite the evolution of trading technology, the fundamental principle remains the same: understanding who is buying and selling, how aggressively, and at what prices provides a real-time window into market sentiment.
How the Time and Sales Window Works
The time and sales window is a continuous scrolling display of every trade that executes in a given security. Each line (or "print") contains the following information:
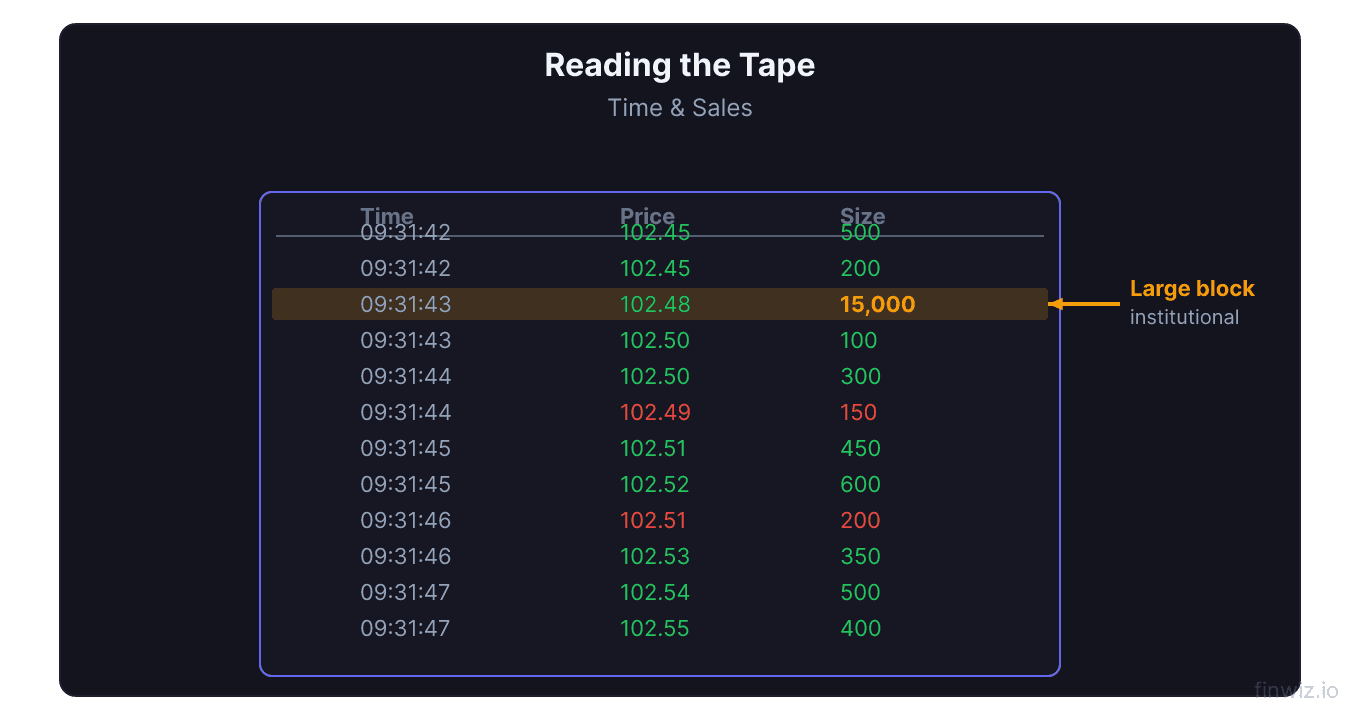
Time. The exact timestamp of the trade, usually down to the millisecond.
Price. The price at which the trade executed.
Size. The number of shares traded. This can range from a single share to hundreds of thousands of shares in a single print.
Condition. Some platforms show trade condition codes that indicate whether the trade occurred at the bid, at the ask, between the bid and ask, or as an odd-lot, intermarket sweep, or other special trade type.
Most platforms color-code the time and sales prints for quick visual interpretation:
| Color | Meaning | Interpretation |
|---|---|---|
| Green | Trade at or above the ask | Buyer initiated (bullish) |
| Red | Trade at or below the bid | Seller initiated (bearish) |
| White/Gray | Trade between bid and ask | Neutral (midpoint fill) |
A stream of green prints indicates active buying — buyers are lifting the ask, willing to pay the higher price for immediate execution. A stream of red prints indicates active selling — sellers are hitting the bid, accepting the lower price. The balance between green and red prints, combined with the sizes involved, tells the tape reader which side has more urgency and conviction.
Reading the Speed of the Tape
One of the most important but underappreciated aspects of tape reading is speed — how fast the prints are scrolling. The speed of the tape conveys information that size and price alone cannot.
Fast tape. When prints are scrolling rapidly, it indicates high participation and urgency. A fast tape during an upward move is bullish — many participants are competing to buy. A fast tape during a decline is bearish. Fast tape often occurs during the opening hour, around news events, and during breakouts.
Slow tape. When prints are trickling in slowly, it indicates low interest or indecision. A slow tape during an upward move suggests the rally may be weak and vulnerable to reversal. Price moves on slow tape are less reliable than moves on fast tape.
Acceleration and deceleration. Pay attention to changes in tape speed. If the tape suddenly accelerates — prints start scrolling much faster — it often signals the beginning of a significant move. Conversely, if the tape decelerates during a trend, the trend may be losing momentum.
Identifying Block Trades
Block trades are large individual trade prints, typically 10,000 shares or more, that appear on the time and sales. Block trades are significant because they often represent institutional activity — hedge funds, mutual funds, or other large players entering or exiting positions.
Here is why block trades matter:
Directional signal. A block buy (a large print at the ask) suggests that a significant player is willing to pay the ask price for immediate execution. This urgency implies conviction. Multiple block buys in sequence are a strong bullish signal. The opposite is true for block sells.
Support and resistance creation. When a large institution executes a block trade at a specific price, that price often becomes a reference point. Institutions frequently defend their entry price, creating support at the level where they bought. If price drops to that level, the institution may buy more to protect their position.
Hidden size. Not all large orders appear as single block prints. Many institutions use algorithms to break large orders into thousands of smaller trades executed over minutes or hours. A tape reader might notice a consistent flow of 200-500 share prints at the ask over an extended period — this "drip-feeding" pattern can indicate a large buyer working an order.
| Print Size | Likely Source | Significance |
|---|---|---|
| 100-500 shares | Retail traders, algorithms | Low significance individually |
| 1,000-5,000 shares | Active traders, small funds | Moderate — shows conviction |
| 5,000-10,000 shares | Small institutions, prop firms | High — directional signal |
| 10,000-50,000+ shares | Institutional block trades | Very high — strong conviction |
Pro Tip
Tape Reading Patterns
With experience, tape readers recognize recurring patterns in the flow of prints. Here are the most important ones:
Absorption. Absorption occurs when a large number of sell prints hit a specific price level, but the price does not drop. This means there is a buyer (or buyers) absorbing all the selling pressure at that level. Absorption at support is a powerful bullish signal — it shows that a large player is willing to buy every share being sold, preventing the price from declining. Once the selling subsides, price often moves sharply higher.
Exhaustion. Exhaustion is the opposite of absorption. It occurs when aggressive buying or selling slows down and the prints become smaller and less frequent. If a stock has been rallying with a fast, green-dominated tape and the tape suddenly slows with smaller prints, the buying momentum may be exhausted. A reversal often follows.
Sweeping. When price moves through multiple levels rapidly, with large prints appearing at consecutive ask levels (for an upward sweep) or bid levels (for a downward sweep), it indicates aggressive directional conviction. Sweeps are often triggered by institutional algorithms or large traders who need to build or exit a position quickly.
Hiding. Sometimes the tape shows small, consistent prints at the same price — 100 shares, 200 shares, 100 shares, 300 shares — all at the ask. This repetitive pattern at the same price level can indicate an iceberg order, where a large buyer is hiding their true size by displaying only small portions at a time. The total accumulated size of these small prints can be significant.
Combining Tape Reading With Level 2
Tape reading is most powerful when combined with Level 2 order book analysis. Together, they provide a complete picture of market microstructure.
Level 2 shows what might happen. The order book displays the pending orders — the supply and demand waiting to interact. A large bid on Level 2 suggests potential support. A large ask suggests potential resistance.
The tape shows what is happening. The time and sales display confirms or denies the signals from Level 2. If Level 2 shows a large bid, and the tape shows that bid being filled by wave after wave of selling (absorption), the signal is bullish. If that bid gets pulled without being tested, the Level 2 signal was misleading.
Confirmation framework:
- See a potential setup on the chart (e.g., pullback to support on the 1-minute chart)
- Check Level 2 for supply/demand dynamics at the level (bid/ask sizes, order depth)
- Read the tape for confirmation (absorption, block trades, print color dominance)
- Enter the trade only when all three align
This three-layer approach — chart, order book, and tape — dramatically improves trade quality compared to relying on any single data source.
Tape Reading for Different Trading Styles
While tape reading is most associated with scalping, it adds value across multiple day trading strategies:
For scalpers: The tape is the primary decision-making tool. Scalp entries and exits are based on real-time order flow — absorption, block prints, and tape speed. Chart patterns are secondary context.
For momentum traders: The tape helps confirm that momentum is genuine. Strong momentum is characterized by a fast tape dominated by prints at the ask (for longs), with increasing print sizes. Fading momentum shows up as a slowing tape with smaller prints and more prints at the bid.
For breakout traders: The tape provides critical confirmation at the moment of breakout. A genuine breakout shows a surge of prints at the ask as price pushes through resistance, with size and speed increasing. A false breakout often shows the tape slowing down or printing at the bid shortly after the breakout level is crossed.
For reversal traders: The tape helps identify the exhaustion point of a move. When a stock has been selling off aggressively and the tape shows absorption at a support level — large bids getting filled without price dropping further — it signals that the selling may be finished and a reversal is developing.
Tools and Platforms for Tape Reading
Effective tape reading requires a platform that displays time and sales data clearly and allows customization:
DAS Trader is the industry standard for tape reading among active day traders. Its time and sales window is highly configurable, with filters for minimum trade size, color coding, and speed adjustments. DAS also provides a "montage" view that combines Level 2 and time and sales in a single window.
Sterling Trader Pro offers excellent time and sales functionality with strong order routing and execution capabilities. It is popular among professional prop traders and scalpers.
thinkorswim provides a serviceable time and sales window for most day traders. While not as specialized as DAS or Sterling, it is free and integrates well with the platform's charting and Level 2 features.
Bookmap is a specialized order flow visualization platform that displays the order book and tape in a heatmap format, making it easier to spot large orders and absorption zones. While not a traditional time and sales display, Bookmap provides a unique and powerful way to visualize order flow.
Learning to Read the Tape
Tape reading is a skill that cannot be learned from a book alone. It requires extensive screen time and pattern recognition that develops only through practice. Here is a structured approach:
Phase 1: Observation (weeks 1-4). Open the time and sales window on a liquid stock (SPY, AAPL, or QQQ are good choices). Watch the tape for 30-60 minutes per day during active trading hours. Do not trade based on it — just observe. Start to notice patterns: what does a strong uptrend look like on the tape? What does exhaustion look like?
Phase 2: Correlation (weeks 5-8). Place the time and sales window next to a 1-minute chart. Observe how the tape patterns correlate with price movements. When the tape shows a surge of green prints, watch how the chart responds. Start keeping notes on recurring patterns.
Phase 3: Prediction (weeks 9-12). Begin making predictions based on what you see on the tape. "The tape is showing absorption at this level — I think price will bounce." Track your accuracy. This is still observation mode — no real trading.
Phase 4: Integration (months 4+). Start incorporating tape reading into your paper trading strategy. Use the tape as one of several confirmation tools for your trade entries and exits. Gradually increase your reliance on tape signals as your accuracy improves.
Phase 5: Live application. When you transition to live trading, start with small position sizes and use tape reading to refine — not replace — your existing strategy. As your confidence and accuracy grow, you can increase the weight you give to tape signals.
Common Mistakes in Tape Reading
Avoid these errors that plague new and developing tape readers:
Over-interpretation. Not every print is significant. A single 5,000-share print does not necessarily mean an institution is taking a position. Look for patterns of behavior, not isolated prints.
Ignoring context. The tape must be read in context. A block buy at the beginning of a strong uptrend means something different from a block buy after a stock has already rallied 10%. Always consider where price is relative to key levels and the overall trend.
Analysis paralysis. The tape moves fast, and there is an overwhelming amount of data. Some traders become so focused on reading every print that they freeze and miss trading opportunities. Focus on the key signals (absorption, block trades, tape speed changes) and ignore the noise.
Neglecting the chart. The tape provides micro-level information, but the chart provides macro-level context. A bullish tape signal that contradicts a clearly bearish chart pattern is less reliable than a bullish tape signal that confirms a bullish chart setup. Always start with the chart and use the tape for confirmation.
Disclaimer
This is educational content, not financial advice. Trading involves risk, and you should consult a qualified financial advisor before making any investment decisions. Past performance does not guarantee future results.
Frequently Asked Questions
What is the time and sales window?
The time and sales window is a real-time display on your trading platform that shows every executed trade for a given security. Each entry shows the time of the trade, the price, the number of shares, and typically whether the trade was executed at the bid (sell) or ask (buy). It is color-coded — usually green for buys and red for sells — to allow quick visual assessment of order flow direction.
How do you identify institutional buying on the tape?
Institutional buying can appear as single block prints of 10,000+ shares at the ask. However, institutions often disguise their activity by using algorithms that break large orders into many small prints. Look for sustained, consistent buying pressure — hundreds of small prints at the ask over minutes — or repeated prints of the same size at the same price level, which may indicate an iceberg order. Absorption at a support level (where large amounts of selling are consumed without price dropping) is also a common sign of institutional buying.
Can algorithms replace tape reading?
Algorithms can analyze tape data much faster than humans, and algorithmic trading has certainly changed the landscape. However, many experienced traders argue that the pattern recognition and contextual judgment required for effective tape reading is difficult for algorithms to fully replicate. The best approach for retail traders is to focus on the signals that algorithms cannot easily act on — subtle absorption patterns, shifts in urgency, and contextual supply/demand analysis.
How long does it take to learn tape reading?
Expect to spend 3-6 months of daily practice before tape reading starts to feel natural and provides actionable signals. Like any skill, it develops gradually through repetition. Start by observing the tape for 30-60 minutes per day on one or two liquid stocks, and gradually increase your analysis time and the number of stocks you track. Consistent practice is more valuable than marathon sessions.
Is tape reading still relevant with algorithmic trading?
Yes, tape reading remains relevant despite the prevalence of algorithmic trading. In some ways, it has become even more important because you can observe the patterns that algorithms create — their order sizes, speeds, and behaviors are often recognizable. The key adaptation is understanding that much of the flow on the tape is algorithmic and learning to distinguish between algorithmic noise and genuine directional flow from human traders and institutions.
Related Articles
12 chapters covering charts, indicators, risk management & more. Plus weekly trading insights.