ABCD Day Trade Setup: The Most Reliable Intraday Pattern
⚡ Key Takeaways
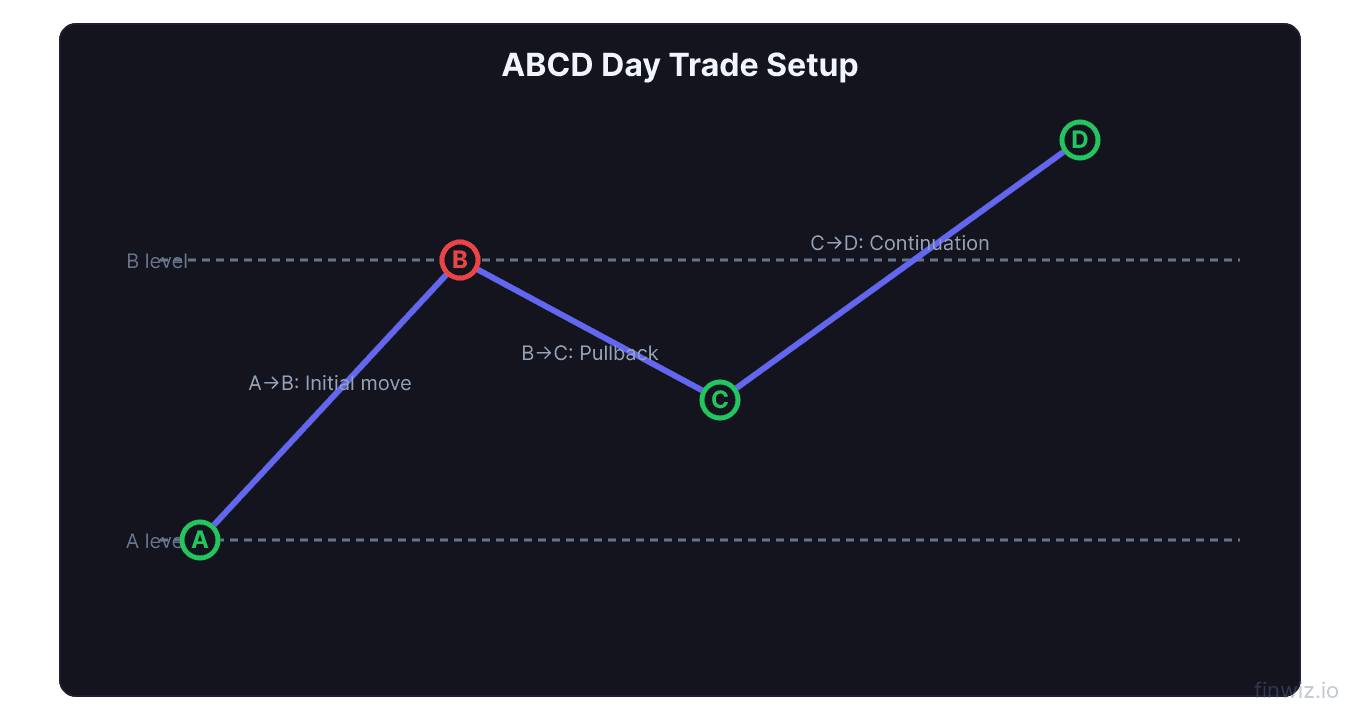
- The ABCD pattern is a four-point price structure consisting of an impulse leg (AB), a pullback (BC), and a continuation leg (CD)
- The BC pullback typically retraces 38.2%-61.8% of the AB leg, aligning with key Fibonacci retracement levels
- The CD leg mirrors the AB leg in both price magnitude and time, giving traders a projected entry and target
- Volume should expand on the AB and CD legs and contract during the BC pullback
What Is the ABCD Day Trade Setup?
The ABCD pattern is a foundational price structure used by day traders to identify continuation moves after a pullback. It consists of four points — A, B, C, and D — that form a zigzag shape on the chart. The pattern captures the natural rhythm of trending markets: impulse, rest, impulse.
Point A is where the initial move begins. Point B marks the end of the first impulse leg. Point C is the end of the pullback (retracement). Point D is where the second impulse leg completes, and where most traders take profits or expect a reversal.
The ABCD pattern is essentially a structured version of the bull flag concept. Where a bull flag identifies a general consolidation after a move, the ABCD pattern defines exact price relationships between each leg using Fibonacci ratios.
The AB Leg: The Initial Impulse
The AB leg is the first strong directional move. On a bullish ABCD, point A is a swing low and point B is the subsequent swing high. This leg should be clean and impulsive — strong candles, expanding volume, minimal overlap between candles.
For day trading, the AB leg often forms in the first 15-30 minutes of the session. A stock gaps up on a catalyst, runs from $22 (point A) to $25 (point B) on heavy volume. That $3 move is the AB leg.
Key characteristics of a valid AB leg:
- Strong momentum with volume expansion
- The move covers significant price distance in a short time
- Candle bodies are large relative to wicks
- The move is driven by a identifiable catalyst (news, earnings, sector momentum)
If the AB leg is weak, choppy, or takes too long to form, the subsequent pattern is less reliable. You want AB legs that show clear demand imbalance.
The BC Leg: The Pullback
After the AB impulse, the stock pulls back. This is the BC leg — a retracement that shakes out weak hands and sets up the next move. The BC pullback is where Fibonacci retracement levels become critical.
BC Retracement = B - ((B - A) x Fibonacci Level)The most common Fibonacci levels for the BC pullback are:
- 38.2% retracement — shallow pullback, indicates very strong momentum. The stock barely dips before buyers step back in.
- 50% retracement — the most common level. Balanced between continuation and reversal risk.
- 61.8% retracement — deep pullback, still valid but indicates weaker momentum. If the stock retraces beyond 61.8%, the pattern is likely invalid.
Using the earlier example: AB leg from $22 to $25 ($3 range). A 50% retracement puts point C at $23.50. A 61.8% retracement puts it at $22.14.
Volume during BC should decline. If the pullback occurs on heavy volume, sellers are in control and the pattern is less likely to complete. Light volume on the pullback confirms that the selling is merely profit-taking, not a trend reversal.
Pro Tip
The CD Leg: The Continuation
The CD leg is the payoff. It begins when the stock reverses off point C and resumes in the direction of the AB leg. The CD leg often mirrors the AB leg in both magnitude and time.
Price Target (D) = C + (B - A)If AB was a $3 move and point C is at $23.50, then the target for point D is $23.50 + $3.00 = $26.50. This is the measured move or 100% extension of AB projected from C.
Entry strategies for the CD leg:
- Aggressive entry: Buy at point C when you see the pullback hold a Fibonacci level and volume dry up. Stop below point A.
- Conservative entry: Buy on the break above point B ($25 in this example). This confirms the pattern but gives you a worse price. Stop below point C.
The conservative entry is recommended for traders learning this pattern. You sacrifice some profit potential but avoid the risk of the pattern failing at point C.
Real-World ABCD Examples
NVDA frequently forms ABCD patterns on the intraday chart following earnings or AI-related catalysts. The stock gaps up, runs for 15 minutes (AB), pulls back to the 50% Fibonacci level over the next 10-15 minutes (BC) on declining volume, then resumes the move (CD). The symmetry between the AB and CD legs is often remarkably precise.
Small-cap momentum stocks also produce clean ABCD patterns. A stock like MARA might gap up 8% on Bitcoin news, run from $18 to $21 (AB), pull back to $19.50 (BC at 50%), then run to $22.50 (CD). The entire pattern plays out in 45-60 minutes.
The ABCD pattern works on pullbacks across all timeframes, but it is most reliable on the 1-minute and 5-minute charts for day trading. Integrate it into your day trading strategies as a core setup for momentum continuation plays.
Frequently Asked Questions
How long does an ABCD pattern take to complete for day trading?
On intraday charts, the full ABCD pattern typically completes in 30-90 minutes. The AB leg might take 10-20 minutes, the BC pullback 10-30 minutes, and the CD leg 10-20 minutes. Patterns that take longer than 2 hours to develop on the 1-minute chart lose their reliability because the initial momentum has faded. The best ABCD day trades complete within the first half of the trading session.
What happens if the BC pullback goes below 61.8%?
If the pullback exceeds the 61.8% Fibonacci retracement, the pattern is considered invalid. A deeper pullback suggests that the selling pressure is stronger than typical profit-taking, and the stock may be reversing rather than consolidating. Do not force the pattern — if point C forms below the 61.8% level, skip the trade and look for a different setup.
Can the ABCD pattern work for short trades?
Yes. A bearish ABCD pattern is the mirror image. Point A is a swing high, point B is a swing low (the first impulse leg down), point C is a retracement bounce (38.2%-61.8% of AB), and point D is the continuation lower. Short entry occurs either at point C (aggressive) or on a break below point B (conservative). Bearish ABCD patterns are common on stocks that gap down on bad earnings and produce a weak bounce before continuing lower.
Disclaimer
This is educational content, not financial advice. Trading involves risk, and you should consult a qualified financial advisor before making any investment decisions. Past performance does not guarantee future results.
12 chapters covering charts, indicators, risk management & more. Plus weekly trading insights.