Pullbacks & Throwbacks: Buying Dips in an Uptrend
⚡ Key Takeaways
- A pullback is a temporary decline within an uptrend, while a throwback is a return to a recently broken resistance level from above
- The 20 EMA is the most popular moving average for identifying pullback buy zones in trending stocks
- Throwbacks that hold above broken resistance confirm the breakout and offer a second-chance entry with defined risk
- Volume should decline during the pullback and expand when the trend resumes, confirming healthy price action
- Combining pullback entries with Fibonacci retracement levels increases the probability of catching the turn
What Is a Pullback?
A pullback is a short-term move against the prevailing trend. In an uptrend, the price temporarily declines before resuming higher. Pullbacks are not reversals. They are pauses that allow a trending stock to digest gains, shake out weak holders, and reload for the next leg.
Every healthy uptrend moves in waves. The stock advances, pulls back, advances again, and pulls back again. Traders who understand this rhythm can enter at favorable prices rather than chasing extended moves.
Consider NVDA during its 2024 advance. The stock repeatedly climbed above its 20-day moving average, pulled back to tag it, and then launched higher. Each pullback to the 20 EMA was a buying opportunity with a clearly defined stop loss just below the average.
The key distinction is depth. A pullback that retraces 20-40% of the prior move is normal. A retracement beyond 50-60% suggests the trend is weakening and a potential reversal is forming. Use Fibonacci retracement levels to measure the depth objectively.
What Is a Throwback?
A throwback occurs after a stock breaks above resistance and then returns to test that broken level from above. The old resistance is now expected to act as new support. When it holds, the throwback confirms the breakout and gives latecomers a second-chance entry.
Throwbacks happen because some traders take quick profits after a breakout, pushing the price back toward the level. If the breakout was genuine, buyers step in at the former resistance, and the stock resumes its advance.
AAPL demonstrated a textbook throwback in early 2024 when it broke above the $195 resistance zone. The stock rallied to $199, pulled back to $195.50, held, and then advanced past $200. Traders who missed the initial breakout could have entered on the throwback with a stop just below $194.
Pro Tip
Pullback vs Throwback: Key Differences
While both provide entries in the direction of the trend, pullbacks and throwbacks differ in context.
A pullback occurs within a well-established trend. The stock is already trending, and the pullback is simply the next wave correction. You are buying a dip within a trend, typically near a moving average or trend line.
A throwback occurs specifically after a breakout. The stock has just cleared a defined level, and the throwback tests whether that level will hold as support. You are buying a confirmed breakout retest.
Both setups share a critical feature: they offer a defined risk point. On a pullback, your stop goes below the moving average or swing low. On a throwback, your stop goes below the broken resistance level. Without a clear invalidation point, neither trade is worth taking.
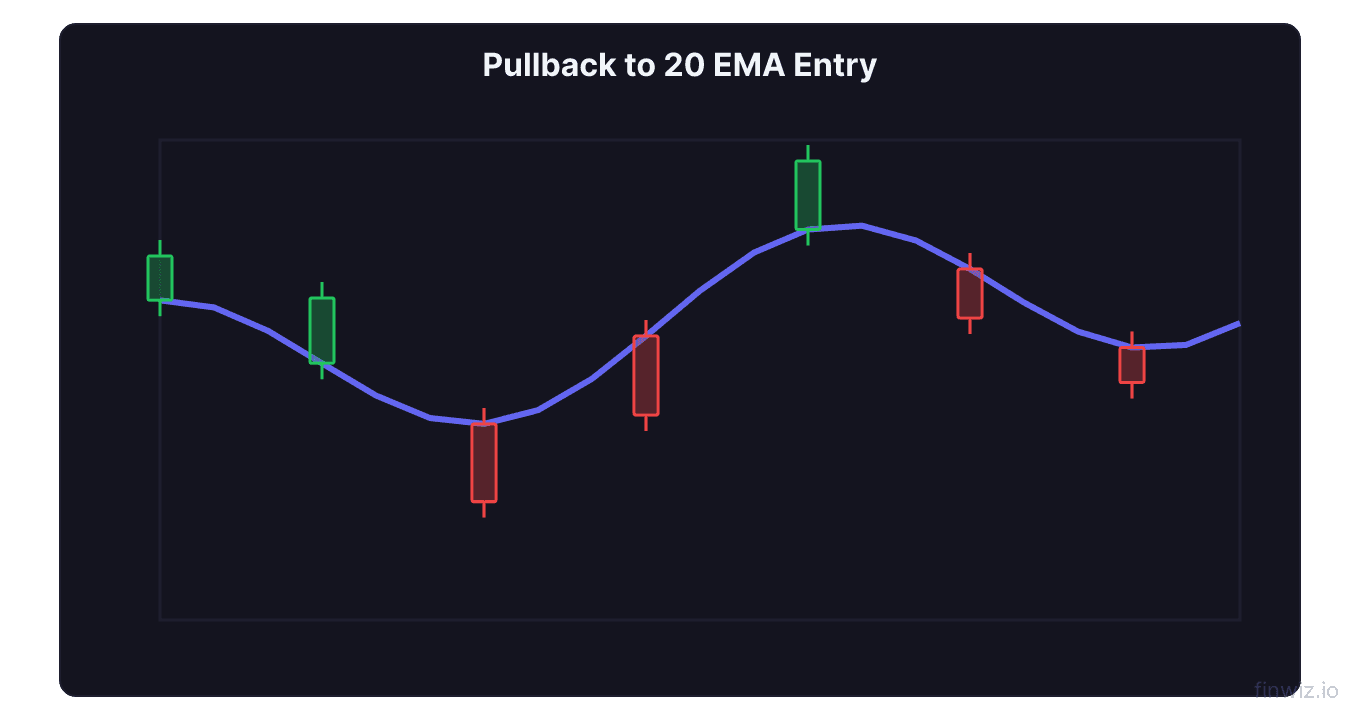
How to Trade Pullbacks to the 20 EMA
The 20 EMA pullback is one of the most reliable entries in trending markets. Here is the framework:
Step 1: Confirm the uptrend. The stock should be making higher highs and higher lows. The 20 EMA should be sloping upward and price should be trading above it.
Step 2: Wait for the pullback. Let the stock decline toward the 20 EMA. Do not buy on the first red candle. Wait until price actually touches or comes within 1% of the moving average.
Step 3: Look for a reversal signal. Watch for a bullish candlestick at the 20 EMA. A hammer, engulfing pattern, or inside bar followed by an upside break all work.
Step 4: Enter on confirmation. Buy when price closes above the high of the reversal candle.
Step 5: Set your stop. Place it below the pullback low or 1-2% below the 20 EMA.
Position Risk = Entry Price - Stop Loss PriceSPY frequently respects the 20 EMA during trending phases. In bull markets, the index can bounce off this average five or six times before a deeper correction develops. Each bounce is a valid pullback entry.
How to Trade Throwbacks to Broken Resistance
Throwback entries require patience because you need a breakout to occur first.
Step 1: Identify resistance. Find a level that has been tested at least twice. The more touches, the more significant the level. Use support and resistance techniques to map these zones.
Step 2: Wait for the breakout. The stock should close above resistance on above-average volume. A weak breakout on low volume is more likely to fail entirely.
Step 3: Wait for the return. Let the stock pull back toward the broken level. Volume should decline during this phase, indicating the pullback is corrective and not a sign of renewed selling.
Step 4: Enter on the hold. When price reaches the broken resistance zone and prints a bullish candle, enter long. The strongest throwback entries show a wick below the level followed by a close above it, indicating buyers defended the zone.
Step 5: Set your stop. Place it below the broken resistance level. If the throwback fails and the stock closes back below the level, the breakout has failed and you exit.
Target Price = Entry Price + (Prior Breakout Rally Distance)Pro Tip
Volume and Momentum During Pullbacks
Volume behavior separates healthy pullbacks from the early stages of a reversal.
During a healthy pullback, volume should contract. Fewer shares are changing hands because the sellers are not aggressive. The pullback is simply a pause, not a distribution event.
When the stock resumes the uptrend from the pullback, volume should expand. This shows fresh buyers entering and the trend reasserting itself.
If volume stays heavy during the pullback and the stock fails to bounce at expected levels, the pullback may be morphing into a reversal. In that case, step aside and wait for the picture to clarify.
Momentum indicators add another layer of confirmation. If RSI holds above 40 during the pullback in an uptrend, the trend is intact. If it drops below 30, the selling is becoming more aggressive than a typical pullback warrants.
FAQ
How many days does a typical pullback last?
Most pullbacks in actively trending stocks last 2-5 days on a daily chart. A pullback that extends beyond 8-10 days is becoming a consolidation or potential trend change rather than a simple dip.
Can you buy pullbacks in a downtrend?
The mirror image works for short sellers. A rally within a downtrend is a pullback that can be shorted when price reaches the declining 20 EMA. However, shorting pullbacks carries more risk because stocks can snap back sharply. Use a stop loss without exception.
What if the throwback breaks back below the level?
That is a failed breakout. Exit immediately and take the small loss. Failed throwbacks often lead to sharp declines because all the breakout buyers are now trapped. Do not average down or hope for recovery. The trade thesis is broken, and risk management demands you move on.
Disclaimer
This is educational content, not financial advice. Trading involves risk, and you should consult a qualified financial advisor before making any investment decisions. Past performance does not guarantee future results.
Related Articles
12 chapters covering charts, indicators, risk management & more. Plus weekly trading insights.