Tick Charts: Time-Free Charts for Scalpers & Day Traders
⚡ Key Takeaways
- Tick charts create a new bar after a specified number of trades (ticks) rather than after a fixed time interval, providing a transaction-based view of market activity.
- Common tick settings use Fibonacci numbers (233, 610, 1597) because they create natural scaling across different activity levels while aligning with the mathematical relationships found in market behavior.
- Tick charts excel during high-activity periods by generating more bars (more data for analysis) and compress during quiet periods by generating fewer bars, automatically adapting to market rhythm.
- Compared to time-based charts, tick charts provide better volume-normalized analysis because each bar represents the same number of transactions, making bar-to-bar comparisons more meaningful.
- Tick charts are primarily used by day traders and scalpers who need granular insight into order flow and transaction pace — they are rarely useful for swing trading or investing timeframes.
What Are Tick Charts?
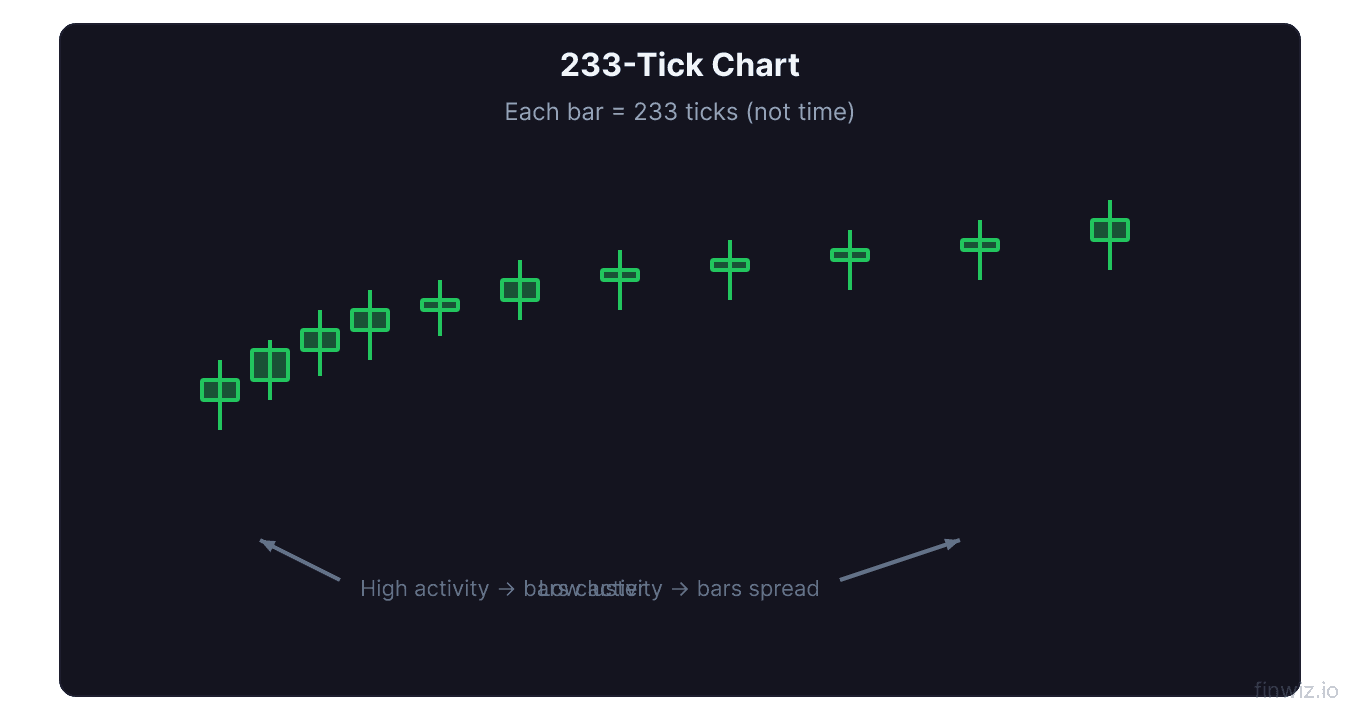
A tick chart builds a new price bar after a predetermined number of transactions (ticks) occurs, rather than after a fixed time period elapses. One "tick" equals one executed trade, regardless of the trade's size. So a 233-tick chart draws a new bar after every 233 trades, with each bar showing the open, high, low, and close of those 233 transactions.
This transaction-based approach fundamentally changes how you see the market. On a standard 5-minute candlestick chart, each bar covers exactly 5 minutes regardless of how much or how little trading activity occurred. During the lunch hour, a 5-minute bar might represent only a few hundred trades. During the opening bell, that same 5-minute bar might contain thousands of trades. The bars look identical on the chart but represent vastly different levels of market participation.
Tick charts solve this problem. During the opening rush, a 233-tick chart produces many bars in a short time — giving you high-resolution data precisely when the market is most active and actionable. During the quiet midday period, bars form slowly, compressing the low-activity noise into fewer data points.
For day traders and scalpers, this activity-based perspective is invaluable because it keeps the chart focused on what matters: actual trading decisions being made by market participants.
How Tick Charts Work
Bar Formation
Each tick chart bar follows the same open-high-low-close format as a regular candlestick, but the trigger for completing a bar is a trade count rather than a time expiration:
Tick Chart Bar Formation:What Counts as a "Tick"
Each individual executed trade counts as one tick, regardless of the trade's share volume. A trade of 100 shares counts the same as a trade of 10,000 shares. This is an important distinction:
- Tick = one executed transaction (any size)
- Volume = total shares traded across all transactions
A single bar on a 233-tick chart always represents exactly 233 transactions, but the total share volume in those 233 transactions can vary widely depending on trade sizes.
Pro Tip
Fibonacci Tick Settings
Why Fibonacci Numbers?
The most popular tick chart settings are drawn from the Fibonacci sequence: 144, 233, 377, 610, 987, 1597, 2584. These numbers are not magic — they are used because:
- Natural scaling: Each Fibonacci number is approximately 1.618x the previous one, creating a geometrically consistent set of chart resolutions from fine to coarse
- Market behavior: Many traders believe market movements exhibit Fibonacci-like proportional relationships, making Fibonacci-based measurement intervals particularly well-suited for detecting these patterns
- Historical convention: The practice was popularized by early tick chart advocates and has become self-reinforcing as more traders adopted these settings
Common Tick Settings and Their Uses
| Tick Setting | Activity Level | Best For |
|---|---|---|
| 144 | Very fine | Scalping, order flow micro-analysis |
| 233 | Fine | Active scalping, fast-moving stocks |
| 610 | Medium | Balanced day trading, most popular setting |
| 987 | Medium-coarse | Swing-style day trading, index futures |
| 1597 | Coarse | Higher-timeframe day trading overview |
| 2584 | Very coarse | Day trading trend identification |
How to Choose Your Setting
The right tick setting depends on the instrument's typical trading volume:
- High-volume stocks (AAPL, MSFT, SPY): Use higher tick counts (610, 987, 1597) because thousands of trades per minute create too many bars at lower settings
- Medium-volume stocks: Use 233-610 ticks
- Lower-volume stocks: Use 144-233 ticks
- Futures (ES, NQ): Use 610-2584 depending on your timeframe preference
A practical test: set up the tick chart and observe whether it generates approximately 3-8 bars per minute during active trading. Too many bars creates visual overload; too few bars lacks the granularity that makes tick charts useful.
Tick Charts vs. Time Charts
The Volume Distribution Problem
The core advantage of tick charts over time charts is how they handle the uneven distribution of trading activity throughout the day.
Consider a typical NYSE trading day:
- 9:30-10:30 AM ET: Very high volume (25-30% of daily volume)
- 10:30 AM-2:00 PM ET: Moderate volume (30-35% of daily volume)
- 2:00-3:00 PM ET: Low-moderate volume (15-20%)
- 3:00-4:00 PM ET: High volume (20-25% of daily volume)
On a 5-minute time chart, the lunch-hour bars and the opening-bell bars look identical in width and visual weight, despite representing dramatically different levels of market conviction.
On a tick chart:
- The active opening hour produces many bars — dense, data-rich visualization
- The quiet lunch period produces few bars — compressed, appropriately de-emphasized
- The active close produces many bars again — high resolution when it matters
Pattern Reliability
Chart patterns formed on tick charts during high-activity periods are generally more reliable than patterns formed on time charts during low-activity periods. This is because each bar on a tick chart represents the same number of trading decisions, making bar-to-bar comparisons statistically consistent.
A double bottom pattern forming on a 610-tick chart during the morning session is composed of bars where each bar represents 610 actual trades — significant market participation. The same pattern on a 5-minute chart during lunch might include bars where only 50 trades occurred — statistically unreliable.
Volume Analysis on Tick Charts
Built-In Volume Normalization
Since every tick chart bar represents the same number of trades, volume analysis takes on a different meaning. On a time chart, a high-volume bar is significant because it shows unusual participation within that time window. On a tick chart, the trade count is constant — so what varies is the share volume per bar and the time taken to form the bar.
Key Volume Insights on Tick Charts
- High share volume bars (same tick count but more shares per trade): Indicate institutional or large-lot activity
- Low share volume bars (same tick count but fewer shares per trade): Indicate retail or small-lot activity
- Fast-forming bars (bar completes quickly): Market is very active, significant price discovery occurring
- Slow-forming bars (bar takes minutes to complete): Market is quiet, price moves are less meaningful
Time-Based Volume Proxy
The speed at which tick chart bars form serves as a real-time proxy for volume intensity. If a 610-tick bar completes in 15 seconds, trading is extremely active. If the same 610-tick bar takes 3 minutes to complete, activity has slowed considerably.
Experienced tick chart traders learn to "feel" the market's rhythm by watching the bar completion speed.
Pro Tip
When to Use Tick Charts
Ideal Scenarios
- Scalping: Tick charts give scalpers the highest-resolution view of trade-by-trade price action
- Futures trading: The ES (S&P 500 futures), NQ (NASDAQ futures), and other index futures are perfectly suited for tick chart analysis due to their consistent trade flow
- Opening and closing sessions: When volume is highest, tick charts provide the most granular data
- News-driven volatility: During rapid price moves driven by news, tick charts capture every step of the move that time charts compress
- VWAP and order flow analysis: Tick charts pair naturally with volume-weighted indicators
Poor Scenarios
- Swing trading: The multi-day to multi-week timeframes of swing trading make tick charts unnecessary — daily candlesticks are more appropriate
- Low-volume stocks: Stocks with fewer than 1,000 trades per day do not generate enough ticks for meaningful tick chart analysis
- Pre-market and after-hours: Low activity means tick charts produce bars so slowly they become impractical
- Fundamental analysis: Tick charts are purely technical tools with no connection to fundamental valuation
Applying Technical Indicators to Tick Charts
Moving Averages
Moving averages on tick charts smooth the last N bars, where each bar is an equal-transaction-count unit. This creates cleaner moving average signals than time-based charts during variable-volume periods.
Effective settings:
- 20-bar EMA: Fast trend signal
- 50-bar EMA: Medium trend
- 200-bar EMA: Major trend reference
VWAP
VWAP is particularly powerful on tick charts because both VWAP and tick charts are volume-sensitive. The VWAP line on a tick chart provides a natural reference for institutional buying (below VWAP) and selling (above VWAP) zones.
RSI and Stochastic
RSI and Stochastic Oscillator signals on tick charts tend to be more consistent than on time charts because the equal-transaction-count bars provide a more uniform statistical sample for the indicator calculations.
Tick Charts in Practice: A Day Trading Example
Here is how a day trader might use a 610-tick chart on the ES (S&P 500 E-mini futures):
9:30 AM - Opening Bell: Tick bars form rapidly (every 5-10 seconds). The first 15 minutes produce approximately 100-150 bars. The trader watches for:
- Initial direction (first few bars establish opening sentiment)
- VWAP as a reference point
- 20-bar EMA for short-term trend direction
10:30 AM - Activity Slows: Bars now take 20-30 seconds to form. Fewer bars mean less chart noise. The trader looks for:
- Price relationship to the morning VWAP
- Whether morning range support/resistance levels hold
- Pattern formation (triangles, flags) during the consolidation
2:00 PM - Activity Increases: As institutional traders return from lunch, bar formation speed accelerates. The trader watches for:
- Breakout from midday consolidation patterns
- Volume confirmation (faster bars + larger share sizes)
- Alignment between 610-tick and 1597-tick chart trends
3:30 PM - Final Push: Maximum bar formation speed. The trader focuses on:
- Trend continuation or reversal heading into the close
- Relationship to the day's VWAP and key support/resistance
- Exit signals on open positions
FAQ
What is the difference between tick charts and volume charts?
Tick charts form a new bar after a set number of trades (transactions). Volume charts form a new bar after a set number of shares (or contracts) are traded. A single large trade of 10,000 shares counts as 1 tick but 10,000 volume. Tick charts measure transaction frequency (how many decisions), while volume charts measure transaction magnitude (how many shares).
Can I use tick charts for stock trading, or are they only for futures?
Tick charts work for any liquid instrument — stocks, ETFs, futures, and forex. However, they are most effective for instruments with consistent, high trade counts. Liquid stocks like AAPL, TSLA, and SPY work well. Stocks with fewer than 500-1,000 trades per day are too illiquid for practical tick chart analysis.
Do tick charts work in backtesting software?
Most professional backtesting platforms support tick charts, but tick-level historical data is harder to obtain and significantly larger than time-based data. Platforms like NinjaTrader, Sierra Chart, and QuantConnect support tick-level backtesting. TradingView supports tick chart visualization but has limited tick-level backtesting capabilities.
How many tick chart bars should I see per day?
This varies by instrument and tick setting. For the ES futures on a 610-tick chart, you might see 1,500-3,000 bars per day. For AAPL on a 233-tick chart, expect 2,000-5,000+ bars per day. If you are seeing fewer than 200 bars per day, your tick setting is too high for that instrument's activity level. If you are seeing more than 5,000, it may be too low.
Are tick charts available on all trading platforms?
No. Not all platforms support tick charts. TradingView, thinkorswim, NinjaTrader, Sierra Chart, TradeStation, and Interactive Brokers TWS all support tick charting. Some brokerages like Robinhood and Webull do not offer tick chart capabilities. Check your platform's chart type options before committing to a tick chart-based strategy.
Disclaimer
This is educational content, not financial advice. Trading involves risk, and you should consult a qualified financial advisor before making any investment decisions. Past performance does not guarantee future results.
Related Articles
12 chapters covering charts, indicators, risk management & more. Plus weekly trading insights.