Accumulation & Distribution: How Smart Money Moves the Market
⚡ Key Takeaways
- Accumulation is the phase where informed institutional investors quietly build large positions before a markup (rally)
- Distribution is the phase where institutions sell their holdings into strength before a markdown (decline)
- The Wyckoff Method provides the most detailed framework for identifying these phases using price and volume analysis
- Volume patterns are the primary tool for distinguishing accumulation from distribution — rising volume on up days and declining volume on down days signals accumulation
- Recognizing these phases early puts you on the same side as institutional money flow
What Are Accumulation and Distribution?
Accumulation and distribution are the two phases of the market cycle where the largest players — institutions, hedge funds, and professional traders — are building or unwinding their positions. These phases precede the major trending moves that most traders try to capture.
During accumulation, smart money buys shares over an extended period, carefully absorbing supply without pushing the price up too quickly. The stock appears to be doing nothing — trading sideways in a tight range — but beneath the surface, ownership is transferring from weak hands to strong hands.
During distribution, the process reverses. Institutions sell their holdings into rallies, offloading shares to retail traders and latecomers who are buying the highs. The stock may still make marginal new highs, but each rally is met with heavy selling that prevents sustained upside progress.
Understanding these phases gives you a structural edge. Instead of buying at the top of a move (during distribution) or selling at the bottom (during accumulation), you can position yourself alongside institutional money flow.
The Wyckoff Framework
Richard Wyckoff developed the most comprehensive framework for understanding accumulation and distribution in the early 20th century, and it remains relevant today. The Wyckoff Method breaks the market cycle into four phases: accumulation, markup, distribution, and markdown.
Accumulation phase characteristics:
- Price trades in a defined range after a decline
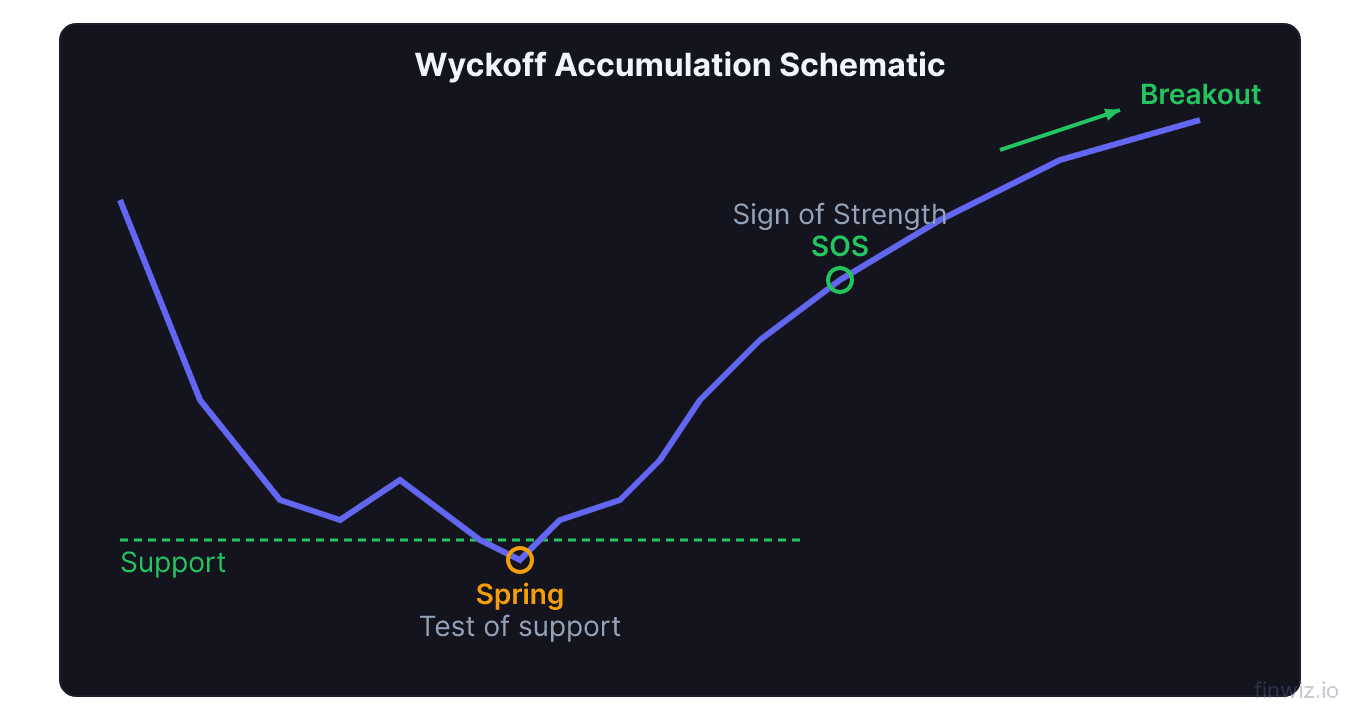
- Early in the range, selling pressure creates sharp drops (the "spring" or "shakeout") designed to trigger stop-losses and create panic selling
- Volume expands on rallies within the range and contracts on pullbacks
- The range narrows over time as supply is absorbed
- A decisive breakout above the range on strong volume signals the transition to markup
Distribution phase characteristics:
- Price trades in a defined range after an advance
- Early in the range, buying pressure creates brief pops to new highs (the "upthrust") that quickly reverse
- Volume expands on declines within the range and contracts on rallies
- Failed breakout attempts above the range trap late buyers
- A decisive breakdown below the range on strong volume signals the transition to markdown
The power of this framework is that it explains why markets behave the way they do at turning points. The consolidation ranges that most traders find boring or confusing are actually the most important phases of the cycle — they are where the next major move is being engineered.
Identifying Accumulation Through Volume
Volume is the most reliable tool for detecting accumulation. The A/D line and on-balance volume (OBV) are two indicators specifically designed to track the flow of volume in relation to price.
During accumulation, look for these volume patterns:
Rising volume on up days — When the stock rallies within the range, volume should increase. This shows buyers are aggressive and willing to absorb shares at higher prices.
Declining volume on down days — When the stock pulls back within the range, volume should decrease. This shows that the selling is passive — holders are not panicking, and supply is drying up.
Volume spikes on shakeouts — A sharp drop below the range on high volume followed by an immediate recovery is one of the strongest accumulation signals. This "spring" flushes out weak holders and allows institutions to buy at discounted prices.
AMZN in late 2022 provided a clear example. After falling from $180 to $85, the stock spent three months trading in a range between $85 and $100. Volume consistently expanded on rallies within that range and contracted on pullbacks. A brief shakeout below $85 on heavy volume was immediately reversed. The stock then broke out above $100 and rallied to $145 over the following months.
Pro Tip
Identifying Distribution Through Volume
Distribution creates the opposite volume pattern. Volume analysis during distribution reveals institutional selling disguised by a range-bound or slightly upward-trending price.
Rising volume on down days — When the stock drops within the range, volume increases. Institutions are using price weakness to accelerate their selling.
Declining volume on rallies — When the stock bounces, volume dries up. There is no genuine buying interest — just short covering and retail buying that cannot sustain the move.
Volume spikes on upthrusts — A brief push above the range on high volume that immediately reverses is the distribution equivalent of the accumulation spring. It traps breakout buyers who then become forced sellers on the subsequent breakdown.
META in late 2021 showed classic distribution. The stock traded between $320 and $380 for several months. Each rally to the upper range produced less volume than the previous one, while declines showed expanding volume. When the stock finally broke below $320, it collapsed to $90 over the following year.
Practical Application: Trading the Phases
The goal is to buy during late-stage accumulation or early markup and sell during late-stage distribution or early markdown.
Trading accumulation:
- Identify a stock that has declined significantly and is now trading sideways
- Confirm accumulation volume patterns (up-volume exceeding down-volume)
- Wait for the spring or shakeout if one occurs — it is the lowest-risk entry
- Enter on the breakout above the range with volume confirmation
- Place your stop below the range low
Trading distribution:
- Identify a stock that has rallied significantly and is now trading sideways at highs
- Confirm distribution volume patterns (down-volume exceeding up-volume)
- Watch for the upthrust — a failed breakout that reverses quickly
- Enter short on the breakdown below the range with volume confirmation
- Place your stop above the range high
Accumulation Signal Strength = (Average Volume on Up Days ÷ Average Volume on Down Days) within the range — values above 1.5 suggest strong accumulationPro Tip
FAQ
How long do accumulation and distribution phases typically last?
There is no fixed duration, but accumulation phases after significant declines typically last 4 to 12 weeks for large-cap stocks. Distribution phases can be shorter because fear moves markets faster than greed. The longer the phase lasts and the more volume-confirmed tests of the range boundaries you see, the more reliable the eventual breakout or breakdown signal becomes.
Can retail traders actually detect institutional accumulation?
Yes, through volume analysis. Institutions cannot hide the volume footprint of buying millions of shares. While they can spread their orders over time and use algorithms to minimize price impact, the cumulative effect shows up in indicators like OBV, the A/D line, and raw volume patterns within the range. You do not need to see the orders directly — the volume tells the story.
What is the difference between accumulation and simple consolidation?
Consolidation is a neutral term for sideways price action. Accumulation and distribution describe the intent behind the consolidation. The difference is found in the volume patterns. Consolidation with no clear volume bias is simply a pause. Accumulation shows volume expanding on up moves and contracting on down moves. Distribution shows the reverse. Without analyzing volume, you cannot distinguish between the three.
12 chapters covering charts, indicators, risk management & more. Plus weekly trading insights.