Market Cycles: The 4 Stages Every Trader Must Recognize
⚡ Key Takeaways
- Every market moves through four stages: accumulation, markup, distribution, and markdown
- The Wyckoff framework provides a systematic method for identifying which stage a market is in
- Volume behavior is the most reliable signal for confirming stage transitions
- Recognizing the current stage lets you align your strategy with the dominant trend rather than fighting it
The Four Stages of a Market Cycle
Markets do not move randomly. They rotate through four distinct stages in a repeating pattern driven by the behavior of institutional investors, economic conditions, and crowd psychology. Richard Wyckoff identified this framework in the early 1900s, and it remains one of the most practical models for understanding price action today.
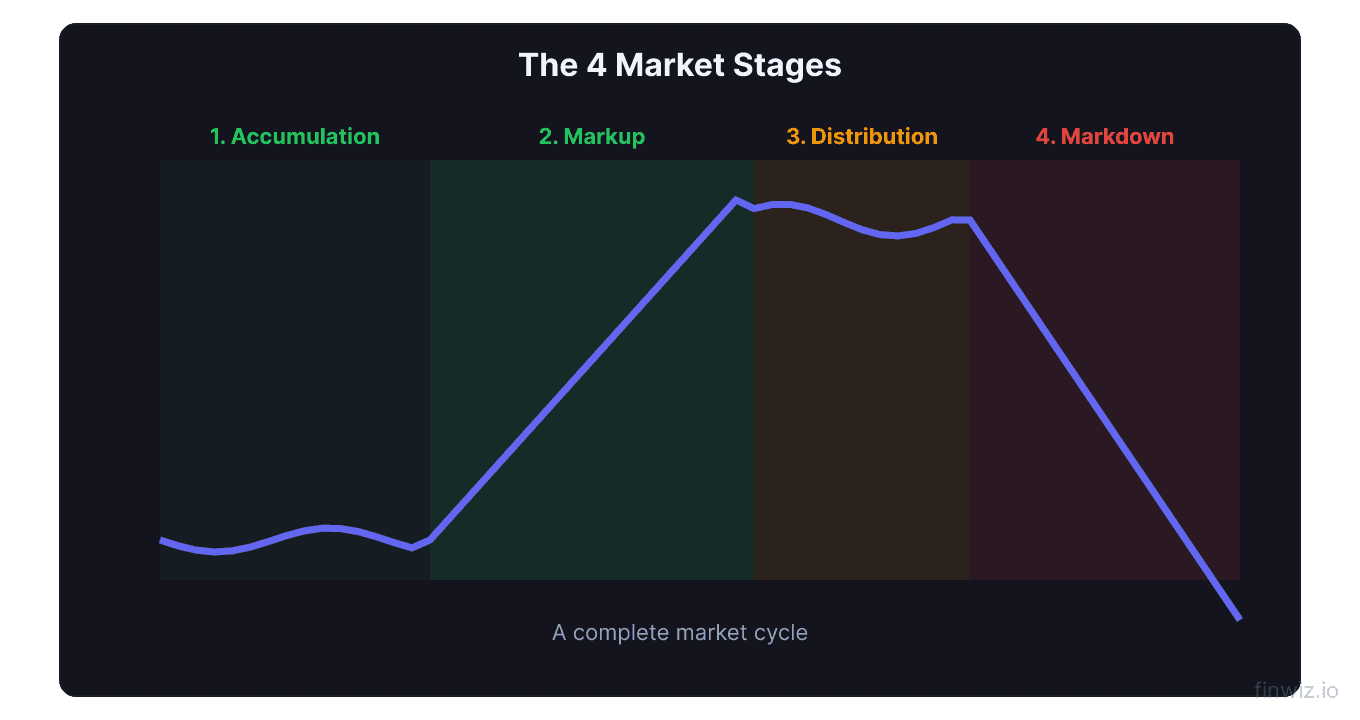
The four stages are accumulation, markup, distribution, and markdown. Each stage has characteristic price behavior, volume patterns, and sentiment profiles. Identifying where a stock, sector, or the broad market sits within this cycle gives you a significant edge in deciding when to buy, hold, or sell.
Think of the cycle like seasons. Accumulation is winter — quiet, overlooked, and full of latent energy. Markup is spring and summer — growth accelerates and optimism builds. Distribution is autumn — the harvest happens and smart money exits. Markdown is the freeze — prices collapse and fear dominates.
Stage 1: Accumulation
The accumulation phase begins after a prolonged decline. Prices have fallen significantly, sentiment is deeply negative, and most retail investors have given up. This is where institutional investors — hedge funds, pension funds, and large asset managers — begin quietly building positions.
Price action during accumulation is sideways and range-bound. The stock trades between well-defined support and resistance levels, often for weeks or months. Volume tends to be higher on up days and lower on down days, signaling that buying pressure is gradually overwhelming selling pressure.
During the 2009 bottom, stocks like JPM and BAC spent months trading in tight ranges between March and July while institutions accumulated shares at depressed valuations. The accumulation & distribution indicator is particularly useful for spotting this behavior.
Pro Tip
Key signals of accumulation:
- Price holds above prior lows despite negative news
- Volume increases on rallies, decreases on pullbacks
- Moving averages flatten after a sustained decline
- Institutional buying shows up in 13F filings with a one-quarter lag
Stage 2: Markup
The markup phase is where the majority of gains occur. Price breaks out above the accumulation range on expanding volume, confirming that demand has overwhelmed supply. This is the stage where the trend is clearly bullish, moving averages turn upward, and momentum indicators confirm the move.
The markup phase of the bull market that began in 2009 lasted roughly until 2018 for many sectors. AAPL rose from roughly $12 (split-adjusted) to over $55 during this extended markup, delivering returns that dwarfed any other stage of the cycle.
During markup, the strategy is straightforward: buy pullbacks to rising moving averages and hold. The 50-day and 200-day moving averages act as dynamic support. Each pullback that holds above prior support creates a higher low, confirming the uptrend remains intact.
Trend Strength = (Current Price − 200-day MA) / 200-day MA × 100When this value is between 5% and 20%, the markup phase is healthy. Values above 30% suggest the trend is overextended and vulnerable to a transition into distribution.
Stage 3: Distribution
The distribution phase mirrors accumulation — but in reverse. Institutional investors who bought during accumulation and rode the markup are now selling into strength. Prices move sideways at elevated levels, and volume shifts: heavier on declines, lighter on rallies.
This stage is the most deceptive because it still looks and feels bullish on the surface. The financial media is optimistic, earnings reports are strong, and retail investors are enthusiastic buyers. But underneath, the smart money is exiting. Sector rotation often accelerates here as money moves from aggressive growth into defensive sectors.
CSCO in early 2000 is a textbook distribution example. The stock traded between $55 and $80 for several months while volume surged on selloffs — institutional investors were distributing shares to eager retail buyers before the dot-com collapse.
Warning signs of distribution:
- Price makes marginal new highs on declining volume
- Breadth deteriorates — fewer stocks participate in rallies
- Defensive sectors outperform cyclical sectors
- Volatility increases within the trading range
Stage 4: Markdown
The markdown phase is the decline. Price breaks below the distribution range, moving averages roll over, and selling accelerates. This stage corresponds to the bear market and is characterized by lower highs and lower lows.
Markdown can be gradual or violent. The 2022 markdown in growth stocks was relatively orderly, with META declining from $380 to $90 over ten months. The 2020 COVID crash was a compressed markdown that took the S&P 500 down 34% in just 23 trading days.
The key discipline during markdown is capital preservation. Avoid the temptation to "buy the dip" until there is evidence of a new accumulation phase forming. Rallies during markdown are bear market rallies — they trap buyers and resume the downtrend.
Wyckoff Effort vs. Result: If high volume (effort) produces little price movement (result), the current trend is weakening and a stage transition is likely.Applying the Wyckoff Framework
Wyckoff's framework works across all timeframes and asset classes. The weekly chart of the S&P 500 reveals multi-year cycles, while a daily chart of an individual stock may complete a full cycle in months. The principles remain the same: identify the stage, align your strategy, and watch volume for confirmation.
Combine cycle analysis with sector rotation to find the highest-probability trades. During late markup, rotate from growth into defensives. During accumulation, look for beaten-down sectors with improving volume patterns.
How long does each stage of a market cycle last?
There is no fixed duration. Accumulation and distribution can last weeks to months. Markup phases in secular bull markets have lasted years (2009–2020). Markdown phases average 12–18 months but can be as short as one month (2020 COVID crash). Volume and price structure matter more than time.
Can a stock skip stages?
Rarely. Parabolic stocks sometimes transition directly from markup to markdown without a clear distribution phase — this happens when a catalyst triggers sudden selling. But in most cases, all four stages appear. The distribution phase may simply be compressed.
What is the best indicator for identifying the current stage?
No single indicator is definitive, but the Accumulation/Distribution Line, On-Balance Volume (OBV), and the relationship between price and the 50/200-day moving averages provide the strongest signals. When price is range-bound and OBV is rising, accumulation is underway. When price is range-bound and OBV is falling, distribution is in progress.
12 chapters covering charts, indicators, risk management & more. Plus weekly trading insights.