Yield Curve Explained: Normal, Inverted & What It Predicts
⚡ Key Takeaways
- The yield curve plots interest rates of U.S. Treasury bonds across different maturities, from 1-month bills to 30-year bonds
- A normal yield curve slopes upward because longer maturities carry more risk and demand higher yields
- An inverted yield curve (short-term rates above long-term rates) has preceded every U.S. recession since 1970
- The 10-year minus 2-year Treasury spread is the most widely watched yield curve indicator, and it inverted in 2022 for the longest stretch in decades
- Yield curve signals work on long time horizons — inversions can precede recessions by 6 to 24 months
What Is the Yield Curve?
The yield curve is a graph that plots the interest rates (yields) of U.S. Treasury bonds across all available maturities at a single point in time. It answers a simple question: how much does the government pay to borrow money for 3 months versus 2 years versus 10 years versus 30 years?
Under normal circumstances, lenders demand higher compensation for tying up their money for longer periods. That is why a savings account pays less than a 10-year CD. The same principle applies to government bonds. A 30-year Treasury typically yields more than a 2-year Treasury because investors face more uncertainty over three decades than two years.
The yield curve matters to every investor because it reflects the bond market's collective forecast for economic growth, inflation, and Federal Reserve policy. When the shape of the curve changes dramatically, it sends powerful signals about the economy's future direction.
Understanding Treasury Maturities
The U.S. Treasury issues debt across a spectrum of maturities. Each serves different purposes and attracts different buyers.
Treasury bills (T-bills) mature in one year or less. Common maturities include 1-month, 3-month, 6-month, and 12-month bills. These are considered the safest investments in the world and serve as the benchmark for the risk-free rate.
Treasury notes (T-notes) have maturities of 2, 3, 5, 7, and 10 years. The 10-year Treasury note is the single most important bond in the world — its yield serves as the benchmark for mortgage rates, corporate borrowing costs, and stock valuations through discounted cash flow models.
Treasury bonds (T-bonds) mature in 20 or 30 years. These ultra-long-duration instruments are most sensitive to inflation expectations and attract institutional investors like pension funds and insurance companies that need to match long-term liabilities.
The Three Shapes of the Yield Curve
The yield curve takes three primary shapes, and each tells a different story about the economy.
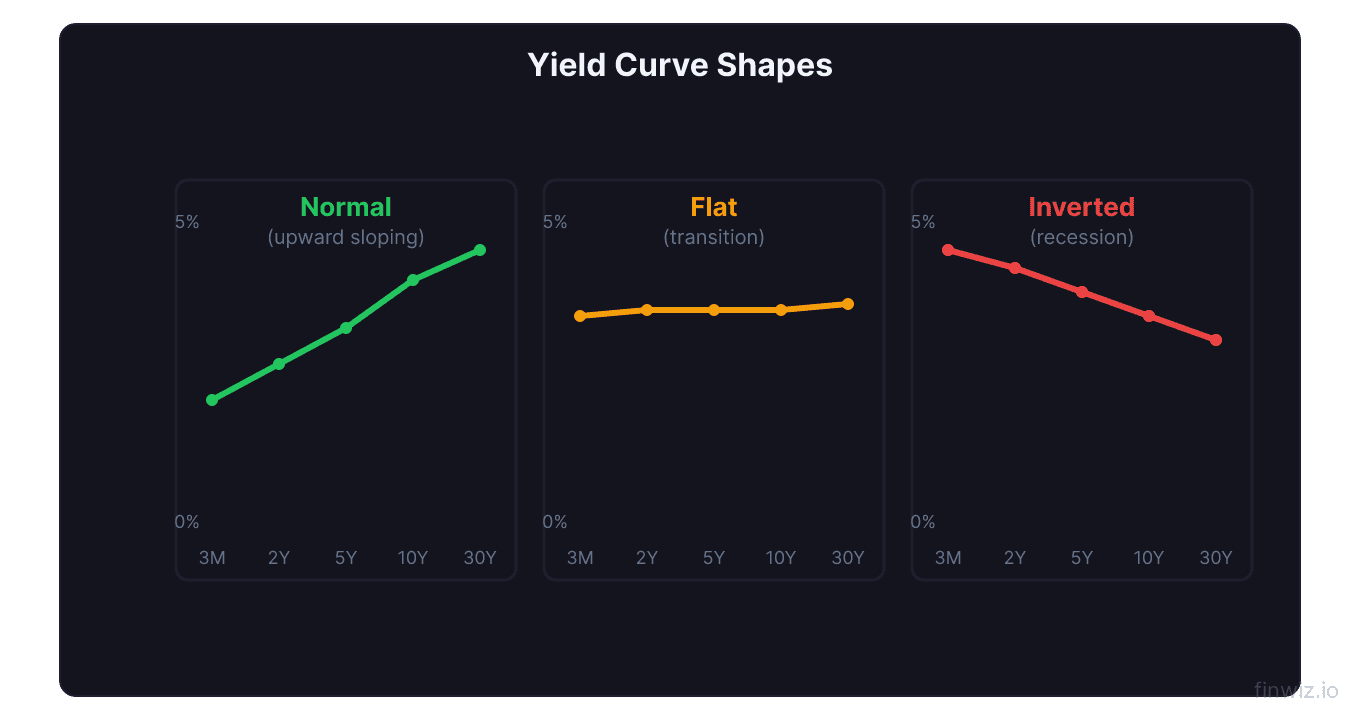
Normal (Upward-Sloping) Yield Curve
A normal yield curve slopes upward from left to right. Short-term rates sit below long-term rates, reflecting the natural expectation that investors should earn more for lending money over longer periods. This shape dominates during periods of healthy economic expansion.
For example, in a typical normal curve environment, the 2-year Treasury might yield 3.0% while the 10-year yields 4.5% and the 30-year yields 5.0%. The positive spread between short and long maturities reflects optimism about future growth and stable inflation expectations.
Flat Yield Curve
A flat yield curve occurs when short-term and long-term rates converge, offering similar yields across all maturities. This shape typically appears during transition periods — either when the Fed is raising short-term rates aggressively or when the bond market senses economic uncertainty ahead.
When the curve flattens, it removes the incentive for banks to lend. Banks profit by borrowing at short-term rates and lending at long-term rates. When the spread between those rates narrows, banks tighten lending standards, which can slow economic activity.
Inverted Yield Curve
An inverted yield curve occurs when short-term rates exceed long-term rates — the curve slopes downward from left to right. This is the bond market's recession alarm. It means investors are so pessimistic about the future that they are willing to accept lower yields on long-term bonds, locking in current rates before they fall further.
Pro Tip
An inverted yield curve does not cause a recession — it reflects market expectations that the Federal Reserve will eventually be forced to cut rates significantly due to economic weakness. The inversion is a symptom of anticipated trouble, not the disease itself.
The 10-Year Minus 2-Year Spread
While the full yield curve contains many data points, traders focus most on the 10Y-2Y spread — the difference between the 10-year Treasury yield and the 2-year Treasury yield.
10Y-2Y Spread = 10-Year Treasury Yield − 2-Year Treasury YieldWhen the 10Y-2Y spread turns negative, the yield curve is officially inverted. The Federal Reserve Bank of New York also publishes a closely watched model using the 10-year minus 3-month spread, which some economists argue has even stronger predictive power.
The average lead time between an inversion and a recession is approximately 12 to 18 months, though it has ranged from as few as 6 months to as many as 24 months. This variability makes the signal valuable for long-term planning but unreliable for precise market timing.
The Yield Curve's Recession Track Record
The inverted yield curve has an extraordinary track record as a recession predictor. Every U.S. recession since 1970 was preceded by a yield curve inversion.
- 1970 recession: Curve inverted in late 1968, recession began December 1969
- 1973-75 recession: Inversion in mid-1973, recession started November 1973
- 1980 recession: Inversion in late 1978, recession began January 1980
- 1981-82 recession: Curve inverted again in 1980, recession started July 1981
- 1990-91 recession: Inversion in mid-1989, recession began July 1990
- 2001 recession: Curve inverted in February 2000, recession started March 2001
- 2007-09 Great Recession: Inversion in late 2005, recession began December 2007
- 2020 recession: Brief inversion in August 2019, recession began February 2020
The 2020 case is particularly notable. The yield curve inverted briefly in August 2019, and many dismissed it as a false signal driven by global central bank distortions. Then COVID-19 triggered the sharpest economic contraction in modern history just six months later. While the virus itself was unpredictable, the economy was already vulnerable — exactly what the yield curve was signaling.
The Historic 2022 Inversion
The 10Y-2Y spread inverted in July 2022 and remained negative for an extraordinarily long period. At its deepest point, the spread reached approximately -108 basis points (meaning the 2-year yielded more than 1% above the 10-year), the deepest inversion since the early 1980s.
This inversion was driven by the Federal Reserve's aggressive interest rate hiking campaign to combat inflation. The Fed pushed the federal funds rate from near zero to over 5%, which dragged short-term Treasury yields sharply higher. Long-term rates rose as well but not nearly as much, because the bond market expected the Fed would eventually cut rates as the economy weakened.
What made the 2022 inversion unique was its duration. The curve remained inverted for over two years, far longer than any previous inversion cycle. This extended duration sparked intense debate about whether the yield curve's recession-predicting power had finally broken down or whether the lag was simply longer than usual.
How the Yield Curve Affects Stocks
The yield curve's shape has direct implications for equity markets and sector rotation.
Steepening curve (bullish): When the curve steepens from flat or inverted back to normal, it often signals the early stages of a new bull market. The Fed is cutting rates, banks can profit from lending again, and economic recovery is anticipated. Growth stocks and cyclical sectors tend to outperform.
Flattening curve (caution): A flattening curve typically accompanies late-cycle dynamics. Defensive sectors like utilities and consumer staples tend to outperform. Traders begin positioning for a potential downturn.
Inverted curve (defensive): During inversions, bank stocks tend to underperform because their lending margins compress. Value stocks and dividend-paying companies often hold up better than speculative growth names.
Pro Tip
Do not sell all your stocks the moment the yield curve inverts. Historically, the S&P 500 has delivered positive returns in the 12 months following an inversion about half the time. The curve is a long-lead indicator, not a timing tool. Use it for strategic positioning, not panic selling.
How to Monitor the Yield Curve
Tracking the yield curve is straightforward with free tools available to any investor.
The U.S. Treasury Department publishes daily yield data for all maturities on its website. The Federal Reserve Bank of St. Louis (FRED) provides interactive charts of the 10Y-2Y spread and the 10Y-3M spread going back decades.
Most financial data sites including Yahoo Finance, CNBC, and MarketWatch display current Treasury yields. Brokerage platforms like Thinkorswim and Bloomberg Terminal offer yield curve visualization tools.
Key data points to watch daily include the 2-year yield (most sensitive to Fed policy expectations), the 10-year yield (benchmark for the economy), and the spread between them. Pay attention to the direction of change as much as the absolute level — a spread that is negative but improving tells a different story than one that is negative and worsening.
Yield Curve and Bond Investing
The yield curve's shape directly affects bond investment strategy. In a normal curve environment, investors earn a term premium for holding longer-duration bonds. In an inverted curve environment, short-term instruments actually pay more, making T-bills and money market funds surprisingly attractive.
During the 2022-2024 inversion, investors could earn over 5% in short-term T-bills — a higher yield than the 10-year bond with virtually no duration risk. This created an unusual dynamic where "boring" cash instruments competed aggressively with stocks for investor capital.
Understanding the curve also matters for bond portfolio duration management. When you expect rates to fall (curve normalizing from inversion), extending duration can lock in higher yields and generate capital gains as bond prices rise. When you expect rates to rise, shortening duration reduces portfolio sensitivity to rate increases.
Limitations of the Yield Curve as a Predictor
While the yield curve's recession track record is impressive, it is not infallible. There have been instances of false positives — brief inversions that were not followed by recessions, particularly in international markets. The U.S. track record is stronger, but the lead time is highly variable.
Central bank interventions have also complicated the signal. Quantitative easing (QE) programs, where the Fed purchases long-term bonds, artificially suppressed long-term yields. This may have caused inversions to appear sooner or deeper than they would have in a free market.
Global capital flows add another distortion. When European and Japanese bond yields turn negative, foreign investors pour into U.S. Treasuries, pushing down long-term yields regardless of domestic economic conditions. This globalization of bond markets means the U.S. yield curve now reflects worldwide dynamics, not just American economic expectations.
Frequently Asked Questions
What causes the yield curve to invert?
The yield curve inverts when short-term interest rates exceed long-term rates. This typically happens when the Federal Reserve raises the federal funds rate aggressively to fight inflation while the bond market simultaneously prices in future rate cuts due to expected economic weakness. The combination of high short-term rates and expectations for lower future rates creates the downward slope.
How far in advance does the yield curve predict a recession?
Historically, the lead time between a yield curve inversion and the onset of a recession has ranged from 6 to 24 months, with an average of approximately 12 to 18 months. This wide range makes the yield curve valuable as a strategic warning signal but unreliable as a precise timing tool for market decisions.
Should I sell my stocks when the yield curve inverts?
Not necessarily. While every recession since 1970 was preceded by an inversion, the stock market has often continued to rise for months or even a year after the initial inversion. Selling immediately would have caused you to miss significant gains in many historical episodes. A more practical approach is to gradually shift toward more defensive positioning — reducing speculative holdings, raising cash levels, and ensuring your portfolio is diversified.
What is the difference between the 10Y-2Y spread and the 10Y-3M spread?
Both measure the slope of the yield curve, but they use different short-term benchmarks. The 10Y-2Y spread compares the 10-year note to the 2-year note, while the 10Y-3M spread compares the 10-year note to the 3-month bill. Some research, particularly from the New York Fed, suggests the 10Y-3M spread has slightly stronger predictive power. In practice, both inversions tend to occur close together and convey similar warnings.
Can the yield curve predict stock market crashes?
The yield curve is better at predicting economic recessions than stock market crashes specifically. Recessions almost always involve bear markets, but not all market corrections or crashes are recession-related. The 1987 crash, for example, was not preceded by a meaningful inversion. Use the yield curve as one input alongside other indicators like the VIX, market breadth, and corporate earnings trends.
Disclaimer
This is educational content, not financial advice. Trading involves risk, and you should consult a qualified financial advisor before making any investment decisions. Past performance does not guarantee future results.
Related Articles
12 chapters covering charts, indicators, risk management & more. Plus weekly trading insights.