VIX Explained: How to Read the Market's Fear Gauge
⚡ Key Takeaways
- The VIX (CBOE Volatility Index) measures expected 30-day volatility of the S&P 500 derived from options prices
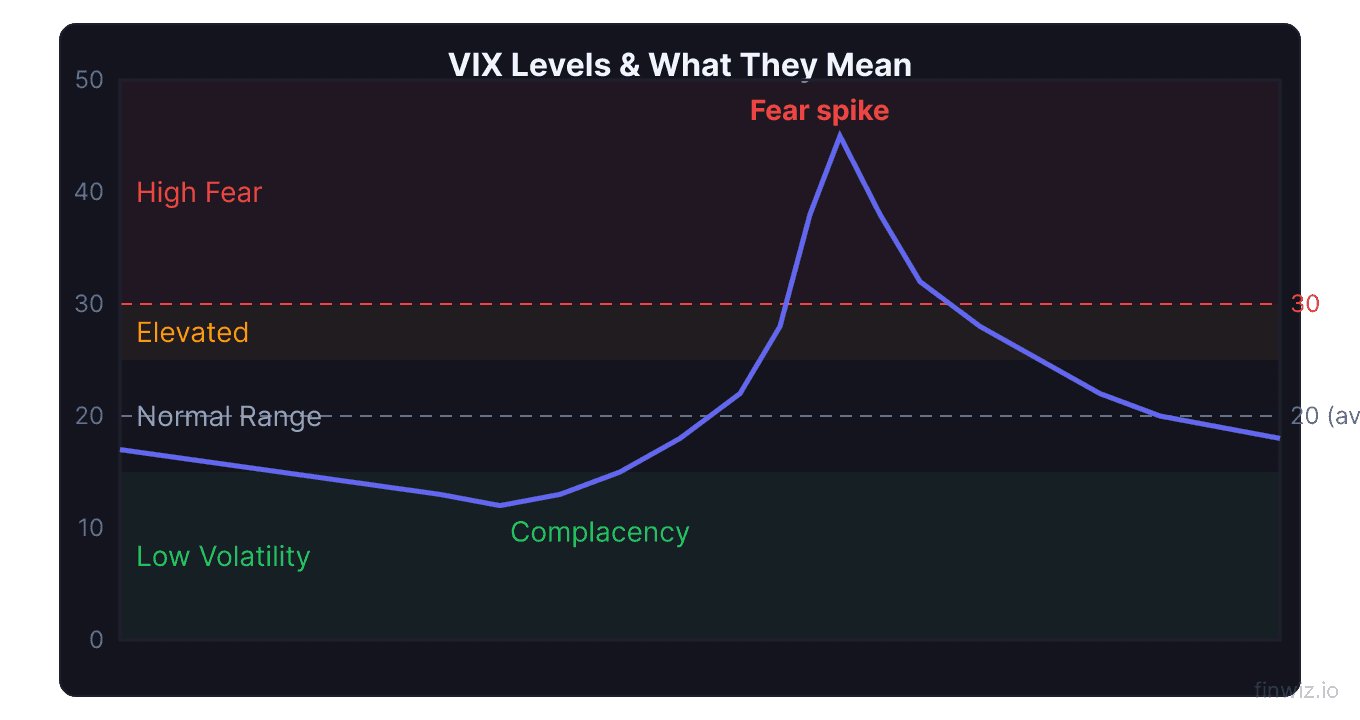
- VIX below 15 indicates low fear/complacency; VIX above 30 signals significant fear; above 40 indicates extreme panic
- VIX futures are typically in contango (upward-sloping), which creates a persistent drag on long VIX products
- The VIX is a mean-reverting indicator — extreme readings tend to reverse toward the long-term average of ~19
What Is the VIX?
The VIX, officially the CBOE Volatility Index, measures the stock market's expectation of 30-day forward volatility based on S&P 500 index option prices. Often called the "fear gauge" or "fear index," the VIX rises when investors are anxious about future market moves and falls when they are calm.
The VIX is not a measure of direction — it does not tell you whether the market will go up or down. Instead, it measures the magnitude of expected price swings. A VIX of 20 implies the market expects the S&P 500 to move approximately 20% annualized (or about 1.25% per day) over the next 30 days.
Created by the CBOE in 1993 and updated to its current methodology in 2003, the VIX has become one of the most widely watched indicators in global finance. It is quoted in real time during market hours and has spawned an entire ecosystem of tradable products.
How the VIX Is Calculated
The VIX derives its value from the prices of S&P 500 index options (SPX) across a wide range of strike prices. The calculation uses both puts and calls expiring approximately 30 days in the future.
VIX Simplified Concept:Key points about the calculation:
- It uses out-of-the-money options because they are most sensitive to volatility expectations
- It weights options across many strike prices, providing a comprehensive picture
- It interpolates between two expiration series to target exactly 30 calendar days
- It is expressed in annualized percentage points (a VIX of 20 means ~20% expected annual volatility)
The VIX is often called "implied volatility" because it is derived from option prices that imply what the market expects future volatility to be.
Interpreting VIX Levels
| VIX Level | Market Condition | Interpretation |
|---|---|---|
| Below 12 | Extremely low volatility | Complacency, possible storm ahead |
| 12–15 | Low volatility | Calm, bull market conditions |
| 15–20 | Normal volatility | Typical market environment |
| 20–25 | Elevated volatility | Increased uncertainty |
| 25–30 | High volatility | Significant fear, possible correction |
| 30–40 | Very high volatility | Major market stress |
| Above 40 | Extreme fear | Crash or crisis conditions |
The VIX's long-term average is approximately 19.5. It has reached its highest levels during major crises: 82.69 during the 2020 COVID crash, 80.86 during the 2008 financial crisis, and 45.74 during the 2011 European debt crisis.
Pro Tip
VIX and Mean Reversion
The VIX is one of the most mean-reverting financial instruments. After extreme readings, it consistently returns toward its long-term average. This characteristic is foundational to VIX trading strategies.
After high VIX readings (above 30):
- The VIX has historically reverted below 20 within 1-3 months in most cases
- The S&P 500 has produced above-average forward returns following VIX spikes
- Selling VIX-related products (shorting volatility) has been historically profitable after spikes
After low VIX readings (below 12):
- Prolonged low VIX periods often precede increases in volatility
- A VIX below 12 does not mean a crash is imminent — it can stay low for months
- Buying cheap portfolio protection when VIX is low is cost-effective
VIX Futures: Contango and Backwardation
VIX futures trade on the CBOE Futures Exchange and are the building blocks of all VIX-related ETPs. The term structure of VIX futures — the shape of the futures curve — is critical for understanding VIX products.
Contango (normal state, ~80% of the time): Longer-dated VIX futures trade at higher prices than near-term futures. This upward slope reflects the market's natural tendency to expect uncertainty to increase over longer time horizons.
Backwardation (crisis state, ~20% of the time): Near-term VIX futures trade at higher prices than longer-dated futures. This inverted curve occurs during market crises when near-term fear is extreme.
Contango Roll Cost (monthly) ≈ (Second Month Future − First Month Future) ÷ First Month FutureTrading VIX Products
Several products allow traders to take positions on volatility:
VIX options (VIX). Options on the VIX index itself. These settle into VIX futures, not the VIX spot level. Important for hedging and speculation.
VIX futures. Direct futures contracts on the VIX. Trade on CBOE Futures Exchange. Available in weekly and monthly expirations.
Long volatility ETPs: Products like VXX and UVXY provide exposure to short-term VIX futures. Due to contango roll costs, these products lose value over time and are suitable only for short-term tactical positions, not buy-and-hold.
Short volatility ETPs: Products like SVXY provide inverse VIX exposure, profiting when volatility declines. These benefit from contango but face catastrophic risk during VIX spikes (XIV was terminated after a 96% decline in February 2018).
| Product | Exposure | Best For | Key Risk |
|---|---|---|---|
| VIX Options | VIX futures | Hedging, speculation | Settlement complexity |
| VXX | Short-term VIX futures | Short-term fear hedges | Persistent contango decay |
| UVXY | 1.5x short-term VIX futures | Leveraged fear trades | Amplified contango decay |
| SVXY | −0.5x short-term VIX futures | Selling volatility | Catastrophic upside risk |
VIX as a Portfolio Hedging Tool
The VIX has a strong negative correlation with the S&P 500 — typically between −0.7 and −0.85. This makes VIX-related instruments effective hedges for equity portfolios.
Hedging with VIX calls: Buying out-of-the-money VIX call options provides asymmetric protection. A small allocation (1-2% of portfolio value) in VIX calls can offset significant portfolio losses during a market crash.
Hedging with SPX puts vs. VIX calls: Both protect against market declines, but VIX calls provide more leverage during crashes because the VIX can double or triple while the S&P 500 declines 20-30%.
The challenge is cost. VIX options are expensive because the VIX is highly volatile, and time decay erodes their value quickly. Systematic hedging with VIX products requires careful position sizing and timing.
VIX Trading Strategies
Mean reversion. Sell volatility (or buy equities) when VIX spikes above 30-35, and buy volatility (or reduce equity exposure) when VIX drops below 12. This strategy has strong historical returns but faces tail risk during extended crises.
Term structure trades. Trade the spread between different VIX futures months. When contango is steep, selling near-month and buying far-month futures captures the roll yield.
VIX-based asset allocation. Some systematic strategies use the VIX level to adjust equity allocation: reduce stocks when VIX is high and rising, increase when VIX is high and falling.
FAQ
What does a VIX of 20 mean?
A VIX of 20 means the options market expects the S&P 500 to move approximately 20% annualized over the next 30 days. In daily terms, this translates to expected moves of roughly 1.25% per day (20% divided by the square root of 252 trading days).
Can you buy the VIX directly?
No. The VIX is an index, not a tradable security. You can gain VIX exposure through VIX futures, VIX options, or VIX-linked ETPs like VXX and UVXY. Each tracks the VIX differently, and none perfectly replicate the spot VIX.
Why do VIX ETFs lose money over time?
VIX ETFs like VXX hold short-term VIX futures and must continuously roll expiring contracts into more expensive longer-dated contracts (contango). This roll cost creates a persistent drag that erodes the ETF's value, even if the spot VIX is unchanged. VXX has lost more than 99% of its value over its lifetime.
Is a high VIX bullish or bearish?
A high VIX typically accompanies market declines and is associated with bearish conditions in the short term. However, because the VIX is mean-reverting, extremely high VIX readings (above 35-40) have historically been bullish signals for forward 3-12 month returns. The market tends to perform well after fear peaks.
How does the VIX relate to market crashes?
The VIX spikes dramatically during market crashes. It reached 82.69 during the COVID crash and 80.86 during the 2008 financial crisis. These extreme readings indicate maximum fear and uncertainty. Historically, buying equities when the VIX is extremely elevated has produced strong subsequent returns.
Disclaimer
This is educational content, not financial advice. Trading involves risk, and you should consult a qualified financial advisor before making any investment decisions. Past performance does not guarantee future results.
Related Articles
12 chapters covering charts, indicators, risk management & more. Plus weekly trading insights.