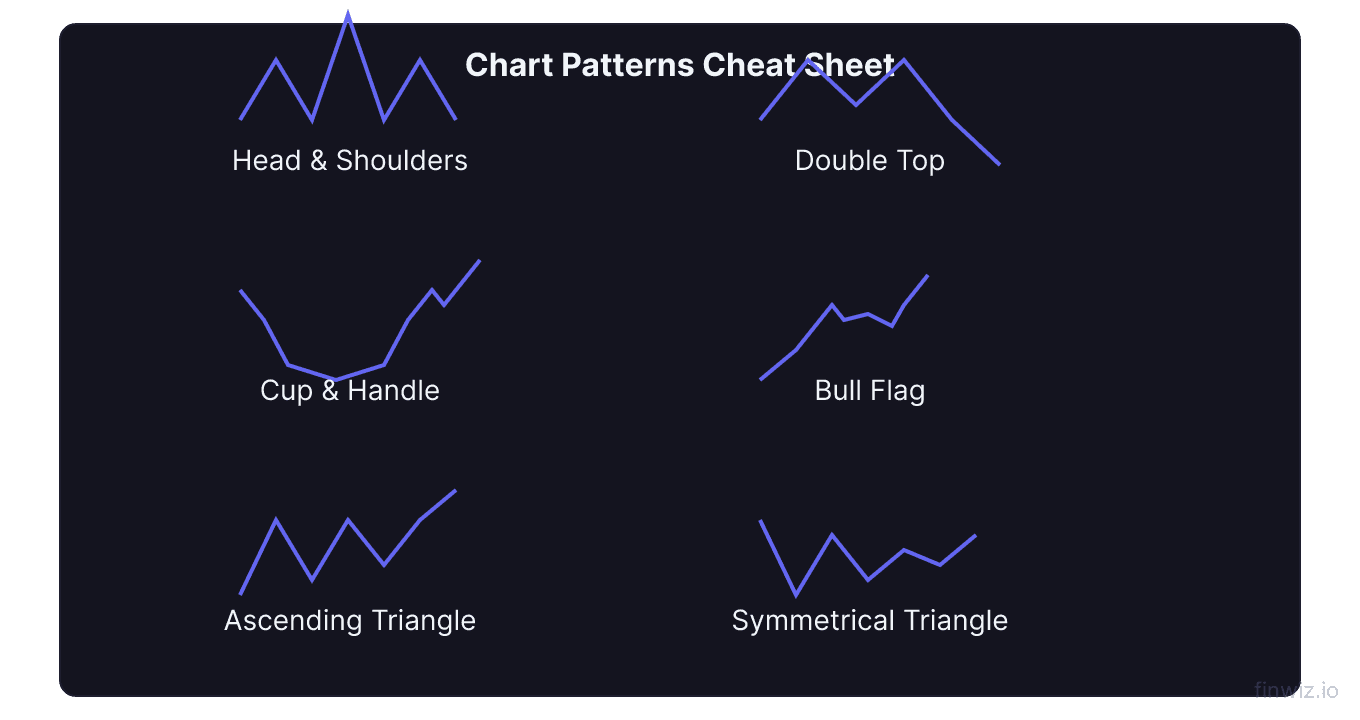
Stock Chart Patterns: The Complete Guide to 30+ Patterns
⚡ Key Takeaways
- Chart patterns are visual formations on price charts that signal potential future price movements
- Patterns fall into three categories: reversal patterns, continuation patterns, and bilateral patterns
- The most reliable patterns are confirmed by volume and occur at key support/resistance levels
- No pattern works 100% of the time — always use stop losses and risk management
The Complete Guide to Stock Chart Patterns
Chart patterns are specific price formations that appear on stock charts, signaling potential future price movements. Technical analysts have identified and cataloged these patterns over more than a century of market observation. They work because they reflect the collective psychology of buyers and sellers at key decision points.
Patterns form when a stock's price consolidates — moving sideways within a defined range — before eventually breaking out in a new direction. The shape of the consolidation provides clues about whether the breakout will be upward (bullish) or downward (bearish).
Understanding chart patterns is a foundational skill in technical analysis. While no pattern guarantees a specific outcome, combining pattern recognition with volume analysis, relative strength, and risk management creates a powerful trading framework.
Categories of Chart Patterns
All chart patterns fall into three broad categories:
Reversal patterns signal that the current trend is likely to change direction. A bullish reversal pattern forms at the end of a downtrend and signals a potential move higher. A bearish reversal pattern forms at the end of an uptrend and signals a potential decline.
Continuation patterns signal that the current trend is likely to resume after a brief pause. These patterns represent consolidation within an existing trend and are often the most reliable because they align with the dominant market direction.
Bilateral patterns can break out in either direction. These require patience — you wait for the breakout direction before taking a position.
| Category | Signals | Examples |
|---|---|---|
| Reversal | Trend change | Head & shoulders, double top/bottom |
| Continuation | Trend resumption | Flags, pennants, wedges |
| Bilateral | Either direction | Symmetrical triangles, rectangles |
Reversal Patterns
Head and Shoulders
The head and shoulders is one of the most reliable reversal patterns. It forms three peaks: a left shoulder, a higher head, and a right shoulder that is approximately equal in height to the left shoulder. The neckline connects the lows between the peaks.
A break below the neckline confirms the pattern and signals a downward move. The measured target is the distance from the head to the neckline, projected downward from the breakout point.
The inverse head and shoulders is the bullish version, forming at the bottom of a downtrend with three troughs.
Head and Shoulders Price Target:Double Top and Double Bottom
The double top forms when price reaches a resistance level twice and fails to break through, creating an "M" shape. It signals a bearish reversal. The target is the height of the pattern projected downward from the neckline.
The double bottom is the bullish counterpart — a "W" shape where price tests a support level twice and bounces. Confirmation occurs when price breaks above the peak between the two lows.
Triple Top and Triple Bottom
Similar to double tops/bottoms but with three tests of the resistance or support level. Triple patterns are rarer but considered more reliable because they demonstrate more persistent resistance or support.
Rounding Bottom (Cup)
A gradual, U-shaped reversal that forms over weeks or months. The cup and handle variation adds a small downward consolidation (the handle) before the breakout, which is a particularly strong bullish pattern.
Pro Tip
Continuation Patterns
Bull and Bear Flags
Flags are short-term continuation patterns that form after a sharp price move (the "flagpole"). The flag itself is a brief, rectangular consolidation that slopes against the prior trend.
A bull flag slopes downward after a sharp rally, then breaks upward to continue the trend. A bear flag slopes upward after a sharp decline, then breaks downward.
The measured target equals the length of the flagpole added to the breakout point.
Pennants
Pennants are similar to flags but form a small symmetrical triangle instead of a rectangle. They appear after a sharp move and represent brief consolidation before the trend continues. Pennants typically resolve within 1-3 weeks.
Ascending and Descending Triangles
An ascending triangle has a flat upper resistance line and a rising lower trendline. This pattern is bullish because buyers are willing to pay progressively higher prices, pushing the floor up toward the ceiling. Breakout above the flat resistance confirms the pattern.
A descending triangle has a flat lower support line and a falling upper trendline. This is bearish — sellers are accepting progressively lower prices. A break below flat support confirms the pattern.
Wedges
Rising wedges form when both trendlines slope upward but converge. Despite the upward slope, this is a bearish pattern — the narrowing range indicates weakening momentum. It usually resolves with a downward breakout.
Falling wedges form when both trendlines slope downward and converge. This is bullish despite the downward slope and typically breaks upward.
Bilateral Patterns
Symmetrical Triangle
Both trendlines converge at approximately equal angles. The pattern can break in either direction, so traders wait for the breakout before committing. Volume typically contracts within the triangle and expands on the breakout.
Rectangle (Range)
Price oscillates between parallel support and resistance levels, creating a box-like pattern. The breakout direction determines the trade. Rectangles often form during periods of indecision or when the market is waiting for a catalyst.
Volume Confirmation
Volume is critical for confirming pattern breakouts. Valid breakouts should occur on above-average volume, demonstrating conviction behind the move. Learn more in our volume analysis guide.
| Scenario | Volume Signal | Interpretation |
|---|---|---|
| Breakout on high volume | Bullish/bearish confirmation | Pattern is valid, follow the breakout |
| Breakout on low volume | Weak signal | Possible false breakout, wait for confirmation |
| Declining volume in pattern | Normal | Consolidation; expect volume surge on breakout |
| Volume spike without breakout | Warning | Possible failed pattern or shakeout |
Candlestick Patterns Within Chart Patterns
Individual candlestick patterns can confirm or deny larger chart pattern breakouts. For example:
- A bullish engulfing candle at the breakout point of a double bottom strengthens the signal
- A doji at a head and shoulders neckline suggests indecision and potential failure
- A marubozu (strong full-body candle) on a flag breakout confirms momentum
Combining chart patterns with candlestick analysis and Wyckoff methodology creates a layered approach that filters out many false signals.
Pattern Trading Rules
Rule 1: Wait for confirmation. Never trade a pattern before the breakout occurs. Anticipating breakouts leads to frequent losses from failed patterns.
Rule 2: Volume must confirm. The breakout candle should show above-average volume. Low-volume breakouts frequently fail.
Rule 3: Set a measured target. Each pattern has a standard price target calculation. Use it to set profit targets and evaluate risk-reward.
Rule 4: Always use stop losses. Place stops below the breakout point for longs (or above for shorts). If the breakout fails, exit quickly.
Rule 5: Context matters. Patterns that align with the broader trend are more reliable than counter-trend patterns. A bull flag in a bull market is more likely to succeed than a bull flag in a bear market.
Quick Reference: 30+ Chart Patterns
| Pattern | Type | Signal | Reliability |
|---|---|---|---|
| Head & Shoulders | Reversal | Bearish | High |
| Inverse Head & Shoulders | Reversal | Bullish | High |
| Double Top | Reversal | Bearish | High |
| Double Bottom | Reversal | Bullish | High |
| Triple Top | Reversal | Bearish | High |
| Triple Bottom | Reversal | Bullish | High |
| Cup & Handle | Reversal | Bullish | High |
| Rounding Bottom | Reversal | Bullish | Moderate |
| Rounding Top | Reversal | Bearish | Moderate |
| Bull Flag | Continuation | Bullish | High |
| Bear Flag | Continuation | Bearish | High |
| Bull Pennant | Continuation | Bullish | High |
| Bear Pennant | Continuation | Bearish | High |
| Ascending Triangle | Continuation | Bullish | High |
| Descending Triangle | Continuation | Bearish | High |
| Rising Wedge | Reversal | Bearish | Moderate |
| Falling Wedge | Reversal | Bullish | Moderate |
| Symmetrical Triangle | Bilateral | Either | Moderate |
| Rectangle | Bilateral | Either | Moderate |
| Diamond Top | Reversal | Bearish | Moderate |
| Diamond Bottom | Reversal | Bullish | Moderate |
| Broadening Top | Reversal | Bearish | Low-Moderate |
| Broadening Bottom | Reversal | Bullish | Low-Moderate |
| Channel Up | Continuation | Bullish | Moderate |
| Channel Down | Continuation | Bearish | Moderate |
| Island Reversal | Reversal | Either | High |
| Gap and Go | Continuation | Either | Moderate |
| Bump and Run | Reversal | Bearish | Moderate |
| Ascending Broadening Wedge | Reversal | Bearish | Low-Moderate |
| Descending Broadening Wedge | Reversal | Bullish | Low-Moderate |
FAQ
Which chart pattern is the most reliable?
The head and shoulders pattern (and its inverse) is widely considered the most reliable chart pattern, with studies showing success rates of 70-85% when confirmed by volume. Flags and pennants in the direction of the prevailing trend are also highly reliable.
Do chart patterns work in all timeframes?
Yes, chart patterns form on every timeframe from 1-minute charts to monthly charts. However, patterns on higher timeframes (daily, weekly) are generally more reliable than those on intraday charts because they represent more significant supply-demand dynamics.
How long does it take for a pattern to complete?
Pattern duration varies widely. Flags and pennants complete in 1-4 weeks. Triangles typically take 1-3 months. Head and shoulders patterns can take 2-6 months. Cup and handle patterns can take 3-12 months. Generally, longer patterns produce more significant moves.
Should I trade failed patterns?
Failed patterns can actually generate powerful trading signals. A failed head and shoulders (where price breaks above the right shoulder instead of below the neckline) often leads to a strong continuation of the uptrend. Failed breakdowns similarly suggest strong underlying buying pressure.
How do I practice identifying chart patterns?
Study historical charts extensively. Review charts across different securities and timeframes. Paper trade pattern setups before risking real capital. Many trading platforms offer pattern recognition tools that highlight formations automatically, which can accelerate learning.
Disclaimer
This is educational content, not financial advice. Trading involves risk, and you should consult a qualified financial advisor before making any investment decisions. Past performance does not guarantee future results.
12 chapters covering charts, indicators, risk management & more. Plus weekly trading insights.