Bull Flag Pattern: How to Trade Bullish Continuations
⚡ Key Takeaways
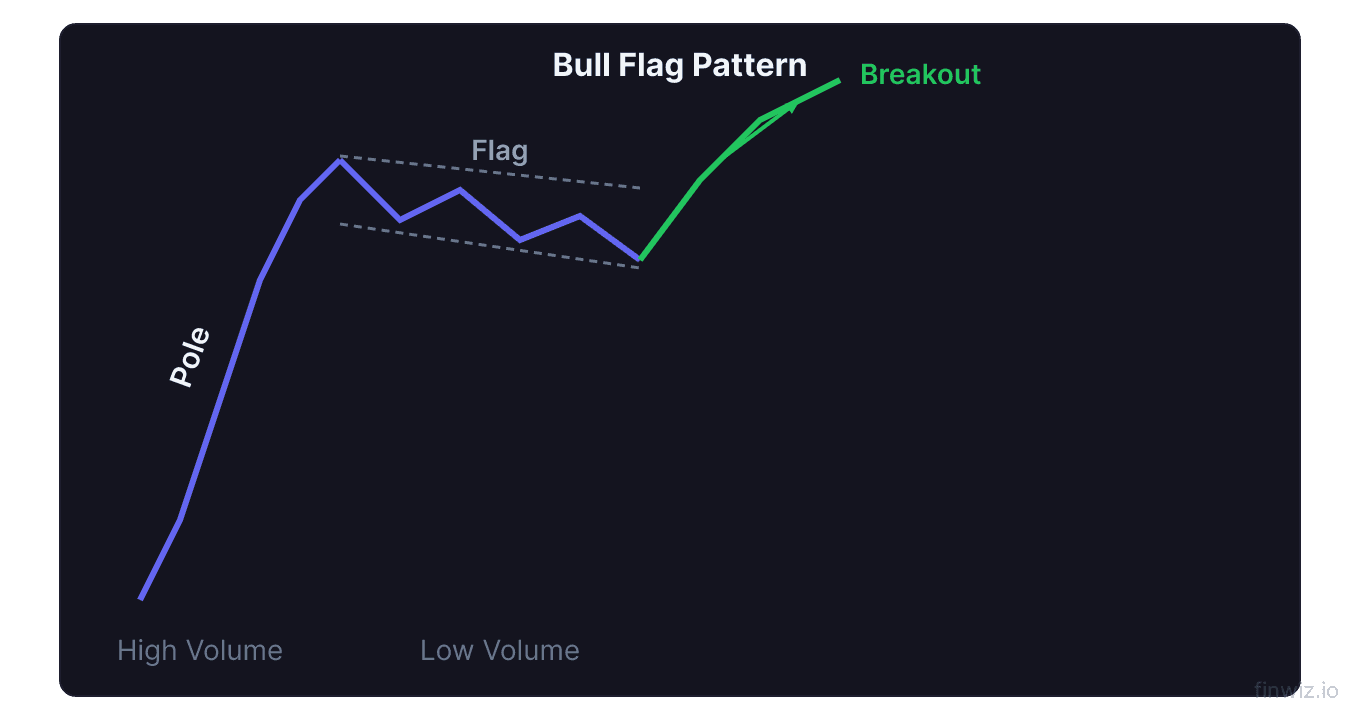
- The bull flag is a bullish continuation pattern consisting of a sharp rally (the pole) followed by a downward-sloping consolidation channel (the flag).
- Volume should be high during the pole formation and decline progressively during the flag consolidation, then expand on the breakout.
- The measured move target equals the length of the pole added to the breakout price.
- Bull flags typically resolve within 1-4 weeks, making them popular among swing traders and active investors.
- The best bull flags form in strongly trending stocks with solid fundamentals and relative strength versus the market.
What Is the Bull Flag Pattern?
The bull flag pattern is one of the most popular continuation patterns in technical analysis. It signals that a strong uptrend is likely to resume after a brief consolidation period. The pattern consists of two components: a steep, nearly vertical price rally called the flagpole, followed by a short consolidation channel that slopes slightly downward or sideways, forming the flag.
Bull flags occur because after a sharp advance, some traders take profits while the majority of holders maintain their positions. This orderly profit-taking creates a controlled pullback that sets the stage for the next leg higher. The pattern reflects healthy market dynamics: strong buying interest, limited selling pressure, and building anticipation for the next move.
This pattern is a favorite of swing traders because it offers a well-defined entry point, clear stop loss level, and a measurable price target. When traded correctly, bull flags can produce excellent risk-reward ratios.
Anatomy of the Bull Flag
Understanding each component helps you identify high-quality setups and avoid false patterns.
The Flagpole
The flagpole is the initial sharp rally that precedes the consolidation. It should be a strong, relatively straight advance that covers significant ground in a short period. The move is driven by aggressive buying, often triggered by a catalyst such as an earnings report, product announcement, or sector rotation.
Key characteristics of a quality flagpole include high volume during the advance, a price move of at least 10-20% in stocks (or equivalent in other markets), and a relatively short duration (days to a few weeks). The steeper and stronger the pole, the more powerful the eventual breakout tends to be.
The Flag
The flag is the consolidation channel that follows the pole. It should slope slightly downward against the prevailing uptrend, forming a parallelogram-like shape bounded by two roughly parallel trendlines. The flag represents an orderly pause, not a significant reversal.
The flag should retrace no more than 38-50% of the flagpole's advance. Deeper retracements suggest that selling pressure is too strong for the pattern to resolve bullishly. A flag that retraces only 20-30% of the pole indicates very strong demand and often leads to aggressive breakouts.
Volume during the flag should contract steadily. Each successive candle within the flag should ideally show lower volume than the previous one. This declining volume confirms that the pullback is driven by mild profit-taking rather than aggressive selling.
Pro Tip
How to Identify a High-Quality Bull Flag
Not all bull flags are created equal. Certain characteristics separate high-probability setups from mediocre ones.
Strong trend context. The best bull flags form within established uptrends, not at the beginning of a potential trend. The stock should be trading above its major moving averages (50-day and 200-day), and those averages should be sloping upward.
Clean pole. The flagpole should show decisive, gap-up style movement with minimal overlap between candles. Poles that grind higher slowly with lots of overlap are less explosive and produce weaker breakouts.
Tight consolidation. The flag should be compact and orderly. Wild, erratic swings within the flag suggest uncertainty rather than orderly profit-taking. The best flags show a gradual, controlled drift lower on declining volume.
Duration. Bull flags typically last between 5 and 25 trading days. Flags that last longer than 4 weeks risk losing the momentum generated by the pole. Very short flags (1-3 days) can also work but may not provide enough consolidation for a sustained breakout.
| Quality Factor | High-Quality Flag | Low-Quality Flag |
|---|---|---|
| Pole Strength | Sharp, gap-up moves | Gradual grind |
| Flag Slope | Slight downward drift | Steep decline |
| Flag Depth | 20-38% retracement | Over 50% retracement |
| Volume Pattern | Steadily declining | Erratic or increasing |
| Duration | 1-3 weeks | Over 4 weeks |
| Trend Context | Strong uptrend | Choppy or unclear |
Trading the Bull Flag Breakout
The entry trigger occurs when price breaks above the upper trendline of the flag on expanding volume.
Entry
The standard entry is to buy when a candle closes above the flag's upper boundary on volume that exceeds the average volume of the flag period. Some traders use an intraday break above the upper trendline, while more conservative traders wait for a daily close above it.
An alternative entry method is to buy at the lower boundary of the flag with a tight stop below. This approach offers a better price but carries the risk that the flag breaks down instead of breaking out. It works best when the overall market is strongly bullish and the stock has exceptional relative strength.
Stop Loss
The primary stop loss goes below the lowest point of the flag. This level represents the point where the pattern has failed, as selling pressure has overcome the consolidation support.
A tighter stop can be placed just below the flag's lower trendline at the point of entry. This reduces risk per share but increases the probability of being stopped out by normal fluctuations within the flag.
Price Target
Price Target = Breakout Price + Flagpole LengthMeasure the length of the flagpole (from the base of the pole to the top). Add that distance to the breakout price. This measured move target represents the minimum expected advance.
For example, if a stock rallies from $50 to $70 (pole = $20), then consolidates in a flag and breaks out at $67, the target is $67 + $20 = $87.
Bull Flag vs. Bear Flag
The bear flag is the mirror image of the bull flag. It features a sharp decline (the pole) followed by a short consolidation that slopes slightly upward (the flag). Bear flags signal continuation of a downtrend.
The key differences lie in the direction and the psychology. In a bull flag, buyers are resting before pushing higher. In a bear flag, sellers are pausing before pushing lower. Volume characteristics are similar: high volume on the pole and declining volume during the flag.
When you see a bull flag forming in one stock and a bear flag forming in another within the same sector, the divergence provides useful information about relative strength. The stock with the bull flag is likely the leader, while the stock with the bear flag is the laggard.
Bull Flag vs. Pennant
The bull flag and bull pennant are closely related continuation patterns, but they differ in the shape of the consolidation.
A bull flag has parallel trendlines that form a rectangular or slightly downward-sloping channel. A pennant has converging trendlines that form a small symmetrical triangle. Both patterns signal the same thing: a temporary pause in an uptrend before continuation.
In practice, the distinction matters less than the overall setup quality. Whether the consolidation takes the form of a flag or pennant, the key factors remain the same: strong pole, contracting volume during consolidation, and expanding volume on breakout.
Pro Tip
Multiple Bull Flags in Sequence
Strong uptrends often produce multiple bull flags in sequence, creating a staircase-like pattern of rallies and pauses. Each successive flag offers a new entry point for traders who missed earlier opportunities.
However, be cautious of late-stage flags. The first and second flags in a series tend to be the most reliable. By the third or fourth flag, the trend may be extended and vulnerable to a larger correction. Each successive breakout often covers a shorter distance than the previous one, as the easy gains diminish.
Watch for the RSI to help identify late-stage flags. If the RSI is making lower highs while the stock makes higher highs during successive flags, this bearish divergence warns that momentum is fading, and the next flag may fail.
Managing Bull Flag Trades
Once you are in a bull flag trade, proper management maximizes your gains while protecting your capital.
Initial stop: Set below the flag low immediately upon entry. This is your maximum risk level.
Breakeven stop: Once the stock moves in your favor by an amount equal to your initial risk, move your stop to breakeven. This creates a risk-free trade.
Trailing stop: As the stock advances toward the measured move target, trail your stop behind significant swing lows or use a moving average as a trailing stop reference. The 10-day or 20-day moving average works well for this purpose.
Target exit: Take at least partial profits when price reaches the measured move target. You can hold a portion for a larger move if the stock shows continued strength and the broader market remains bullish.
Bull Flags in Different Markets
Bull flags appear across all liquid markets, but their characteristics vary.
In stocks, bull flags are among the most common and reliable patterns, particularly in growth stocks with strong earnings catalysts. Stock bull flags benefit from clear market hours that create defined daily candles and volume data.
In forex, bull flags work well on the 4-hour and daily charts. The 24-hour nature of forex means flags tend to be choppier, and volume analysis requires using tick volume as a proxy. Major currency pair bull flags during trending environments produce excellent risk-reward setups.
In cryptocurrency, bull flags can be extremely profitable but also more prone to failure due to the higher volatility. Crypto bull flags should be traded with wider stops and adjusted position sizes to account for larger price swings. Day trading crypto bull flags on lower timeframes is particularly challenging due to the unpredictable volatility.
In futures and commodities, bull flags are common during trending markets, especially in energy, metals, and agricultural products during supply-driven rallies.
Common Mistakes with Bull Flags
Avoid these frequent errors to improve your bull flag trading results.
Confusing a bear flag with a bull flag. In a downtrend, an upward-sloping consolidation is a bear flag, not a bull flag. Always identify the prevailing trend before labeling the pattern.
Trading flags with expanding volume. If volume increases during the flag consolidation, it suggests active selling rather than orderly profit-taking. This often leads to a breakdown rather than a breakout.
Chasing extended breakouts. If you miss the breakout and the stock has already moved 5% or more above the flag, do not chase it. Wait for a pullback to the breakout level or look for the next setup.
Ignoring the broader market. Bull flags in individual stocks fail more often when the overall market is declining. Always consider the market context before entering a bull flag trade. When market indices are pulling back, even the best individual bull flags have a higher failure rate.
Frequently Asked Questions
What is the typical success rate of bull flag patterns?
When properly identified with all criteria met (strong pole, tight flag, declining volume, breakout on expanding volume), bull flag patterns have an estimated success rate of 60-70%. The success rate increases when the pattern forms in a strong uptrend with bullish market conditions and decreases in choppy or bearish environments. Keep in mind that success rate alone does not determine profitability; the risk-reward ratio of each trade matters equally. A 60% win rate with a 2:1 reward-to-risk ratio produces excellent overall returns.
How do I differentiate between a bull flag and a pullback?
A bull flag has specific structural requirements: a sharp, near-vertical pole, a controlled downward-sloping consolidation with declining volume, and a breakout on expanding volume. A simple pullback within an uptrend may lack the sharp pole that precedes the flag, the volume pattern may not show the characteristic decline during consolidation, or the consolidation may be too deep or too erratic. The key differentiator is the pole: if there was not a sharp, high-volume rally immediately before the consolidation, it is likely a standard pullback rather than a bull flag.
Can bull flags form on intraday charts?
Yes, bull flags frequently appear on intraday charts such as the 5-minute, 15-minute, and 1-hour timeframes. Day traders commonly trade intraday bull flags, especially during the first hour of trading when momentum is strong. However, intraday flags are less reliable than daily chart flags because they involve fewer market participants and can be disrupted by intraday news or market noise. If you trade intraday bull flags, use tighter targets and be prepared for faster invalidation of the pattern.
What volume increase should I look for on a bull flag breakout?
Look for breakout volume that is at least 50% above the average volume during the flag period, and ideally above the stock's 50-day average volume. The strongest breakouts often occur on volume that is 100% or more above average. Some traders use a specific volume threshold, such as the volume needing to exceed the highest volume day within the flag. The critical point is that volume should clearly and noticeably expand on the breakout day, confirming that real buying demand is driving the move.
Disclaimer
This is educational content, not financial advice. Trading involves risk, and you should consult a qualified financial advisor before making any investment decisions. Past performance does not guarantee future results.
Related Articles
12 chapters covering charts, indicators, risk management & more. Plus weekly trading insights.