Bear Trap: How Short Sellers Get Squeezed
⚡ Key Takeaways
- A bear trap is a false breakdown below a support level that quickly reverses upward, trapping short sellers and forcing them to cover their positions at higher prices.
- Bear traps frequently trigger short squeezes as trapped short sellers buy to cover, creating additional upward pressure that accelerates the reversal.
- Key identification signals include a breakdown on low volume (weak selling conviction), bullish RSI divergence (price makes a lower low while RSI makes a higher low), and rapid recapture of the broken support level within 1-3 bars.
- Bear traps are often orchestrated by institutional traders who push price below support to trigger stop-loss orders and fill their own buy orders at discounted prices — a practice known as liquidity sweeping or stop hunting.
- Trading a bear trap reversal means buying when price reclaims the broken support level, with a stop below the trap low and a target at the prior resistance or the top of the recent range.
What Is a Bear Trap?
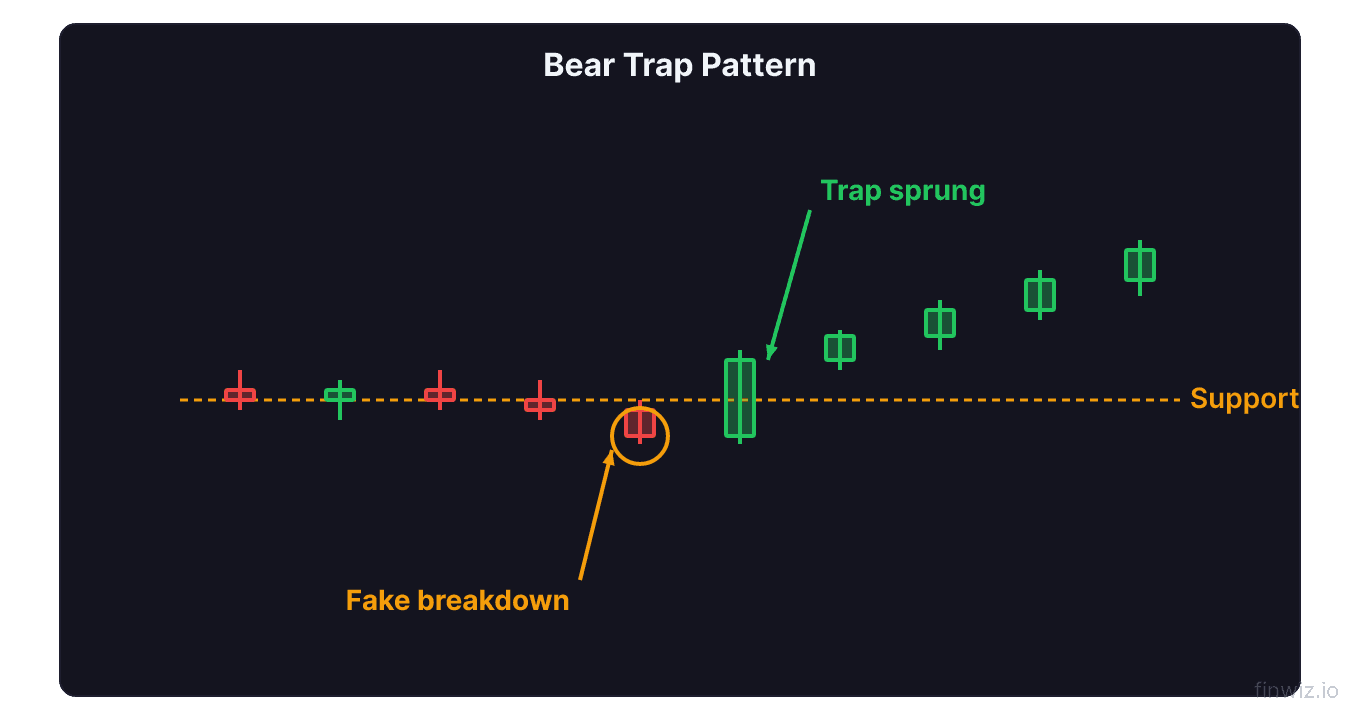
A bear trap is a deceptive price pattern where a stock breaks below a clearly defined support level — convincing traders that a genuine breakdown is underway — only to reverse sharply back above that level. Short sellers and traders who sold their positions on the breakdown are "trapped" as the price moves against them, often accelerating the reversal as they scramble to exit their losing short positions.
Bear traps are the mirror image of bull traps, and they exploit the same psychological vulnerabilities — the tendency to react to what appears to be a confirmed breakout (or breakdown) without waiting for sufficient confirmation. While bull traps punish eager buyers, bear traps punish eager sellers and short sellers.
Understanding bear traps is critical for two groups of traders: those who want to avoid being trapped in short positions after false breakdowns, and those who want to profit from the reversal by buying the failed breakdown. The reversal after a bear trap can be explosive, especially when short covering combines with new buying to create a powerful upside move.
How Bear Traps Develop
Stage 1: Established Support
The trap begins with a clearly visible support level that has been tested and held multiple times. This support could be:
- A horizontal price level where buyers have consistently stepped in
- The lower trendline of a channel
- A key moving average like the 50-day or 200-day SMA
- A Fibonacci retracement level (61.8%, 50%)
- A psychological round number ($50, $100)
The more visible the support level, the more effective the bear trap. Visible support attracts both stop-loss orders (placed just below support by long holders) and short-entry orders (placed just below support by breakdown traders). These clustered orders create a pool of liquidity that can be exploited.
Stage 2: The False Breakdown
Price drops below the support level. This triggers:
- Stop-loss selling from long holders who placed stops below support
- Short entries from breakdown traders who sell/short on the assumption the support has failed
- Algorithmic selling from systems programmed to trade breakdowns
- Panic selling from less experienced traders who interpret the breakdown as the start of a larger decline
The initial selling creates a brief but sharp move below support, which appears to confirm the breakdown. This is the critical moment — the breakdown looks real and feels real.
Stage 3: The Reversal
Within minutes to a few days, buying pressure overwhelms the sellers:
- Institutional buyers who engineered the breakdown now buy aggressively at the discounted prices they created
- Value buyers step in at the lower prices, recognizing the breakdown as an opportunity
- The stop-loss selling exhausts itself — once all the stops below support have been triggered, there are no more forced sellers
Price reverses back above the support level, and the bear trap snaps shut.
Stage 4: The Short Squeeze
The most powerful bear traps produce a short squeeze — an accelerating upside move caused by short sellers being forced to buy back (cover) their positions at higher and higher prices.
When a short seller's position moves against them, they have three choices:
- Hold and hope (risky)
- Cover at a loss (buying pressure)
- Add to the short (even riskier)
Most choose to cover, which means buying shares. This buying pushes the price higher, which triggers more short sellers to cover, which pushes the price even higher — a self-reinforcing cycle that can produce dramatic moves.
Bear Trap Pattern Mechanics:Pro Tip
Identifying Bear Traps: Key Warning Signs
Warning Sign 1: Low Volume on the Breakdown
A genuine breakdown should be accompanied by heavy selling volume — institutional participation confirms the move. If the breakdown occurs on average or below-average volume, it suggests the move lacks institutional conviction and is more likely to reverse.
Check:
- Is breakdown volume less than the 20-day average? (Suspicious)
- Was volume on prior bounces off support higher than breakdown volume? (Very suspicious)
- Is OBV trending upward despite the price breakdown? (Strong bear trap warning)
Warning Sign 2: Bullish RSI Divergence
Bullish RSI divergence occurs when price makes a lower low (the breakdown below support) while RSI makes a higher low. This means momentum is actually improving even as price is declining — a contradiction that often resolves with a price reversal upward.
Example:
- Previous test of $75 support: RSI at 28
- Current breakdown below $75 to $73: RSI at 35
- Price made a lower low, but RSI made a higher low = bullish divergence
This divergence signals that selling pressure is weakening, even though the price action appears bearish. It is one of the strongest warnings that a breakdown may be a trap.
Warning Sign 3: Wick Rejections
If the breakdown candle has a long lower wick (tail), it indicates that sellers pushed price below support but buyers aggressively fought back by the close. A candle that briefly trades below support but closes above it is the textbook "wick rejection" — the market is telling you that the breakdown was tested and rejected.
A hammer candlestick forming at or just below support after a brief breakdown is one of the most reliable bear trap signals.
Warning Sign 4: Bearish Sentiment Extreme
Bear traps frequently occur when bearish sentiment is at an extreme:
- The put/call ratio is elevated (excessive put buying)
- Short interest in the stock is unusually high
- Financial media is overwhelmingly negative about the stock or sector
- The Fear and Greed Index is at extreme fear levels
When everyone is bearish, the remaining selling pressure is limited because most potential sellers have already sold. This creates the conditions for a reversal — there are more potential buyers (bears who need to cover, cash-rich investors looking for opportunities) than potential sellers.
Warning Sign 5: Time and Context
Bear traps are more likely in certain contexts:
- During overall uptrends: Breakdowns within a broader uptrend fail more often because the dominant buying pressure reasserts itself
- Near major support levels: The more significant the support (long-term trendline, 200-day MA), the more likely a brief breakdown will be reversed
- Before earnings or catalysts: Stocks sometimes get manipulated below key levels before positive catalysts that institutional traders already anticipate
- At market correction lows: Bear traps commonly mark the bottom of corrections within bull markets
Institutional Manipulation and Stop Hunting
How Institutions Create Bear Traps
Large institutional traders have the capital to temporarily push prices below support levels for the purpose of accumulating shares at lower prices. The process works as follows:
- Identify stop clusters: Institutions know that retail traders place stop-loss orders just below visible support levels
- Sell aggressively: Push price below support to trigger the stops
- Absorb the selling: Buy the shares being sold by the triggered stops (at discounted prices)
- Let price recover: Once the stops are exhausted and the institutional buy orders are filled, selling pressure evaporates and price rebounds
This practice is sometimes called liquidity sweeping or stop hunting. It is a controversial but well-documented feature of modern markets, particularly in stocks with clearly visible support levels and high short interest.
Dark Pool Activity
Dark pools allow institutions to accumulate large positions without displaying their orders on the visible order book. An institution might be quietly buying millions of shares through dark pools while simultaneously selling a smaller amount on the lit exchange to create the appearance of a breakdown. The dark pool buying represents their true intention; the exchange selling is the manipulation.
Pro Tip
How to Avoid Getting Trapped
Strategy 1: Do Not Short at Support
The most straightforward way to avoid bear traps is to never initiate short positions on the breakdown of well-established support. Instead, wait for a retest:
- Let the breakdown occur
- Wait for a bounce
- If price bounces back above the support level, the breakdown was a trap — do not short
- If price bounces but fails to reclaim support (support acts as new resistance), then the breakdown is confirmed — consider shorting
Strategy 2: Check Volume Before Acting
Before selling on a breakdown, ask: "Is this breakdown happening on above-average volume?" If the answer is no, the breakdown is suspicious. A genuine breakdown with institutional participation should show volume at least 1.5x the 20-day average.
Strategy 3: Use a Delayed Entry
Instead of shorting the moment price drops below support, wait for a daily close below support (not just an intraday violation). Many bear traps involve brief intraday drops below support that reverse before the close. Requiring a closing confirmation filters out a significant percentage of false breakdowns.
Strategy 4: Monitor the Short Interest
Before shorting a breakdown, check the stock's short interest. If short interest is already high (above 15-20% of the float), a breakdown is more likely to trigger a short squeeze than a continued decline. High short interest means many traders have already bet against the stock — adding to that crowded trade increases your risk of a bear trap.
Trading the Bear Trap Reversal
The Long Entry Setup
- Identify the breakdown: Price drops below a well-established support level
- Watch for warning signs: Low volume, RSI divergence, wick rejections
- Wait for recapture: Price closes back above the support level
- Enter long: Buy on the close above support or on the next bar's open
- Stop-loss: Below the bear trap low (the lowest point of the breakdown)
- Target: Prior resistance level, upper boundary of the recent range, or 1x the trap range projected upward
Position Sizing for Bear Trap Trades
Because bear trap reversals can be volatile and the stop-loss must be placed below the trap low (which can be a meaningful distance from the entry), calculate your position size to ensure you are not risking more than 1-2% of your trading capital:
Bear Trap Position Size Calculation:Adding to the Position
If the bear trap reversal shows strength — price moves above the support level with increasing volume, RSI turns upward, and the stock begins making higher highs — consider adding to the position on pullbacks within the new uptrend. Use the recaptured support level as your trailing stop reference.
Bear Traps in Different Market Conditions
Bull Market Bear Traps
During bull markets, bear traps are extremely common because the underlying buying pressure consistently overwhelms brief selling episodes. Breakdowns below support in a bull market should be treated with skepticism until confirmed by sustained selling over multiple days with high volume.
The March 2020 COVID crash produced the ultimate bear trap — the market broke below every conceivable support level, triggering widespread panic selling, only to reverse and rally to new all-time highs within months.
Bear Market Bear Traps
In bear markets, bear traps are less common but still occur. They typically appear as "dead cat bounces" that trap both short sellers (who get squeezed during the bounce) and buyers (who think the bottom is in). In bear markets, confirmed breakdowns below support are more likely to be genuine, so higher confirmation standards are warranted.
Range-Bound Market Bear Traps
In sideways markets, bear traps occur regularly at the bottom of the trading range. Price dips below the range floor, triggers stops, and then rebounds back into the range. These are the most predictable bear traps because the range-bound nature of the market suggests that neither buyers nor sellers have decisive control.
Volume Analysis for Bear Trap Confirmation
Detailed volume analysis provides the most reliable bear trap confirmation.
Volume Profile Evidence
If the volume profile shows a high-volume node (area of concentrated trading volume) just above the support level, the breakdown below that level is less likely to be sustained because the high-volume node represents accepted value. Markets tend to return to accepted value zones.
Accumulation Indicators
The Accumulation/Distribution line and Chaikin Money Flow can reveal institutional buying that contradicts the bearish price action. If these indicators are trending upward while price is breaking down, institutions are accumulating shares — a strong bear trap signal.
On-Balance Volume Divergence
When OBV makes a higher low while price makes a lower low (the breakdown), it confirms that buying volume is stronger than the price action suggests. This divergence is a high-probability bear trap indicator.
FAQ
How long does a bear trap last before reversing?
Most bear traps reverse within 1-3 trading days of the initial breakdown. The fastest bear traps reverse intraday — price breaks below support during the session but closes back above it by the end of the day. Some bear traps take up to a week to fully reverse, particularly in stocks with lower liquidity. If a breakdown persists for more than 5-7 days with sustained volume below support, it is more likely a genuine breakdown than a bear trap.
What is the difference between a bear trap and a dead cat bounce?
A bear trap is a failed breakdown — price drops below support and quickly reverses back above it, continuing higher. A dead cat bounce is a temporary rally within a larger decline — price bounces briefly but then resumes its downtrend. The key distinction is whether the support level is recaptured and held. In a bear trap, the support level is recaptured. In a dead cat bounce, the bounce fails at or below the previous support level, confirming the breakdown.
Can options be used to trade bear traps?
Yes. Buying call options after a suspected bear trap offers leveraged upside with defined risk. If you identify a bear trap forming (breakdown on low volume with bullish RSI divergence), buying at-the-money calls with 30-60 days to expiration captures the reversal with limited downside. Alternatively, selling put options below the trap low collects premium while benefiting from the reversal — if the bear trap thesis is correct, the puts expire worthless. See our options strategies guide for more details.
How do I distinguish a bear trap from a genuine breakdown?
The three most reliable distinguishing factors are: (1) Volume — genuine breakdowns show high volume, bear traps show low volume; (2) Speed of reversal — bear traps reverse quickly (1-3 days), genuine breakdowns see sustained selling; (3) Context — breakdowns within uptrends or range-bound markets are more likely to be traps, while breakdowns within downtrends are more likely to be genuine.
Are bear traps more common in certain sectors?
Bear traps are most common in heavily shorted stocks, high-beta growth stocks, and small-cap stocks where institutional manipulation of support levels is easier due to lower liquidity. They are also common in meme stocks and stocks with passionate retail followings, where buyers aggressively defend support levels. Blue-chip stocks with deep liquidity experience bear traps less frequently because the capital required to push price below support is much larger.
Disclaimer
This is educational content, not financial advice. Trading involves risk, and you should consult a qualified financial advisor before making any investment decisions. Past performance does not guarantee future results.
Related Articles
12 chapters covering charts, indicators, risk management & more. Plus weekly trading insights.