Put/Call Ratio: How to Use This Contrarian Sentiment Indicator
⚡ Key Takeaways
- The put-call ratio measures the volume of put options traded relative to call options
- A ratio above 1.0 indicates more puts than calls, suggesting bearish sentiment or hedging activity
- Contrarian traders use extreme readings as reversal signals — high PCR can signal market bottoms
- Equity PCR and index PCR behave differently and should be interpreted separately
- The put-call ratio is most useful as a confirmation tool alongside price action and other indicators
What Is the Put-Call Ratio?
The put-call ratio (PCR) is a sentiment indicator that compares the trading volume of put options to call options. It provides a snapshot of whether traders are positioning for downside protection (puts) or upside speculation (calls).
Put-Call Ratio = Total Put Volume ÷ Total Call VolumeA PCR of 0.70 means that for every 100 calls traded, 70 puts were traded. A PCR of 1.20 means 120 puts traded for every 100 calls. The ratio is typically calculated daily and tracked over time using moving averages.
The PCR is published daily by the CBOE and is available for individual stocks, equity options as a whole, and index options (like SPX). Each version tells a slightly different story about market sentiment.
How to Calculate and Interpret the Ratio
The basic calculation is straightforward, but interpretation requires context:
| PCR Level | Interpretation | Market Sentiment |
|---|---|---|
| Below 0.50 | Very low put activity | Extreme bullishness/complacency |
| 0.50-0.70 | Low put activity | Bullish sentiment |
| 0.70-1.00 | Balanced | Neutral sentiment |
| 1.00-1.20 | Elevated put activity | Bearish sentiment or hedging |
| Above 1.20 | Very high put activity | Extreme fear/bearishness |
The historical average for the equity PCR is approximately 0.60-0.70, meaning calls typically trade at a higher volume than puts under normal conditions. This is because retail traders tend to be naturally bullish and prefer buying calls.
Pro Tip
The Contrarian Signal
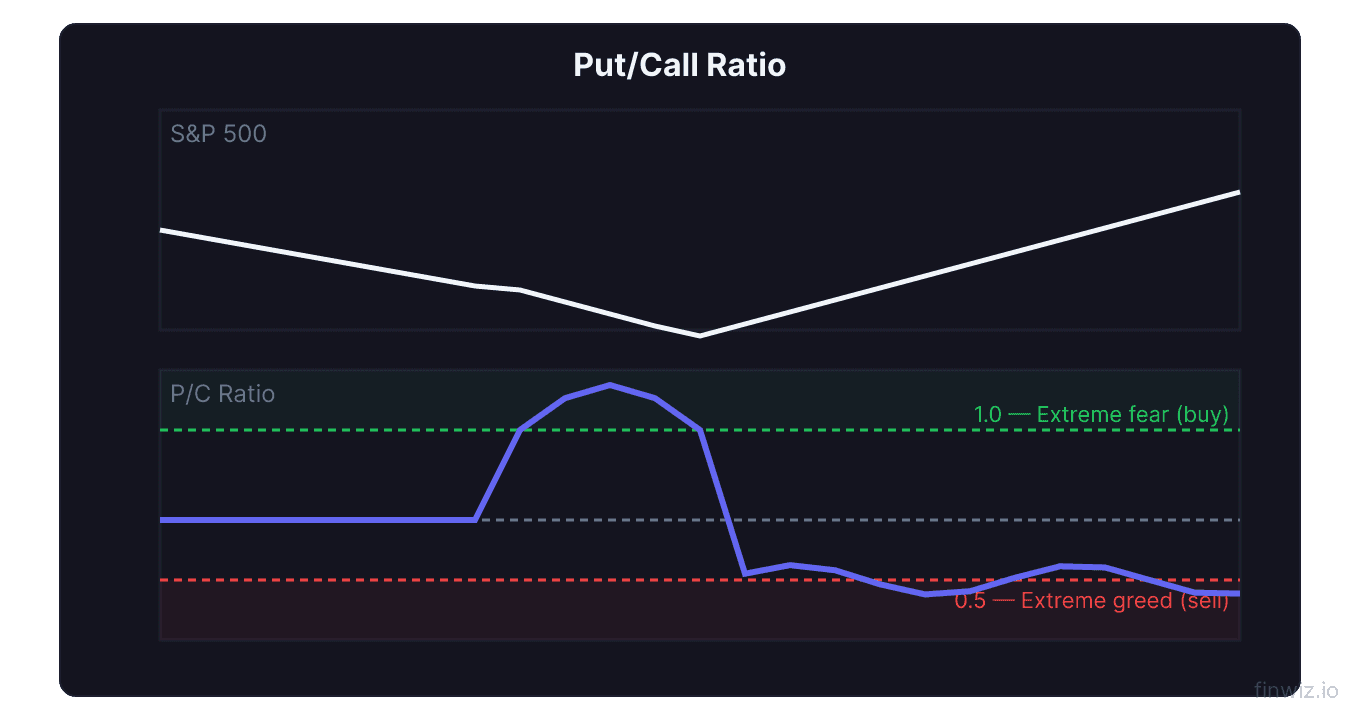
The put-call ratio is primarily used as a contrarian indicator. The logic is simple: when the crowd is overwhelmingly bearish (high PCR), the market is often near a bottom. When the crowd is overwhelmingly bullish (low PCR), the market is often near a top.
This works because of how market psychology operates:
At market bottoms: Fear peaks. Everyone is buying puts for protection. Panic selling has already occurred. There are few sellers left, so any catalyst can trigger a reversal. The high PCR signals maximum pessimism, which is often the best time to buy.
At market tops: Complacency reigns. Everyone is buying calls, expecting further gains. Few bother with puts. When sentiment shifts, there are many sellers and few buyers. The low PCR signals maximum optimism, which is often a warning sign.
| PCR Extreme | Contrarian Signal | Historical Reliability |
|---|---|---|
| PCR above 1.20 | Bullish (buy signal) | Moderate to high |
| PCR below 0.50 | Bearish (sell signal) | Moderate |
| PCR rising sharply | Fear increasing, bottom forming | High at extremes |
| PCR falling sharply | Complacency increasing | Moderate |
Equity PCR vs. Index PCR
There are two main versions of the put-call ratio, and they tell different stories:
Equity PCR measures put and call volume on individual stock options. This is dominated by retail traders and speculators. The equity PCR is the better contrarian indicator because it captures crowd sentiment more directly.
Index PCR (primarily S&P 500 options) is heavily influenced by institutional hedging. Portfolio managers routinely buy index puts to protect large portfolios, regardless of their market outlook. This makes the index PCR naturally higher and less useful as a pure sentiment gauge.
| Feature | Equity PCR | Index PCR |
|---|---|---|
| Typical range | 0.45-1.00 | 0.90-2.00 |
| Dominated by | Retail/speculative traders | Institutional hedgers |
| Contrarian value | High | Moderate |
| Neutral level | ~0.60-0.70 | ~1.20-1.40 |
| Best use | Sentiment gauge | Hedging demand gauge |
The CBOE Total PCR combines both equity and index options. It is the most widely reported but can be misleading because it mixes the two very different participant groups. For pure sentiment analysis, focus on the equity PCR.
Reading PCR Trends
Beyond absolute levels, the direction and speed of PCR changes matter:
Rising PCR from low levels: Fear is building. Early stages of a selloff. Not yet a contrarian buy signal — wait for the PCR to reach extreme levels before buying.
PCR at extreme highs: Fear is peaking. This is where contrarian signals are strongest. Look for the PCR to start declining (fear abating) as a confirmation that the bottom may be in.
Falling PCR from high levels: Sentiment is improving. Often coincides with the early stages of a recovery. This is a constructive signal.
PCR at extreme lows: Complacency is high. The market may be vulnerable to a correction, but low PCR alone does not cause selloffs. Use this as a warning to tighten stops or reduce long exposure.
Combining PCR with price action. The most powerful signals occur when the PCR diverges from price. If the stock market makes new highs but the PCR is rising (more puts being bought), it suggests smart money is hedging, which is a bearish divergence. If the market makes new lows but the PCR is falling, it suggests selling pressure is waning.
PCR for Individual Stocks
You can calculate the put-call ratio for any individual stock using the data from its option chain. This stock-specific PCR can reveal sentiment about a particular company.
Example: Stock XYZ normally has a PCR of 0.50. Ahead of earnings, the PCR spikes to 1.50. This tells you that put volume has surged, suggesting traders are either:
- Betting on a decline after earnings
- Hedging existing long positions ahead of the announcement
- Responding to negative rumors or analysis
However, be cautious with individual stock PCR. A single large block trade can skew the ratio dramatically. Always check whether the unusual options activity is spread across many trades or concentrated in one or two large orders.
Pro Tip
Limitations of the Put-Call Ratio
The PCR is useful but has important limitations:
It does not distinguish between buying and selling. A high put volume could mean traders are buying puts (bearish) or selling puts (bullish). The PCR cannot tell you which. Volume alone is ambiguous.
Institutional hedging distorts the signal. Index put buying is often mechanical, driven by portfolio insurance mandates rather than sentiment. This makes the index PCR less reliable as a contrarian gauge.
It ignores position sizing. 1,000 small retail trades and one massive institutional block both count as volume. The PCR treats them equally, even though the institutional trade carries far more informational value.
Timing is imprecise. Even when the PCR correctly signals a reversal zone, the market can stay at extreme levels for days or weeks before turning. The PCR identifies the zone of a reversal, not the exact timing.
Market structure has changed. The rise of zero-day-to-expiration (0DTE) options has dramatically increased volume, particularly in calls. This has shifted the baseline PCR lower, making historical comparisons less reliable.
Combining PCR with Other Indicators
The PCR works best as one input among several:
| Indicator | Combined Signal |
|---|---|
| PCR high + VIX high | Strong contrarian buy signal |
| PCR low + VIX low | Warning of complacency |
| PCR high + RSI oversold | Very strong buy signal |
| PCR low + RSI overbought | Strong sell/reduce signal |
| PCR diverging from price | Trend exhaustion warning |
The most reliable contrarian signals occur when multiple sentiment indicators align. A high PCR, elevated VIX, oversold RSI, and heavy insider buying together form a much stronger buy signal than the PCR alone.
Frequently Asked Questions
What is a normal put-call ratio?
The equity PCR normally ranges from 0.50 to 0.80, with a long-term average around 0.65. The total PCR (including index options) averages around 0.85-1.00. Values outside these ranges for sustained periods indicate meaningful shifts in sentiment.
Is a high put-call ratio bullish or bearish?
It depends on your perspective. A high PCR is directly bearish (more traders are buying protection or betting on declines). However, from a contrarian perspective, an extremely high PCR is bullish because it signals excessive fear that often coincides with market bottoms.
How often should I check the put-call ratio?
Check the daily PCR each evening and track the 5-day and 10-day moving averages weekly. During periods of market stress or when you are considering major portfolio changes, check it more frequently. Real-time PCR data is available on the CBOE website and most trading platforms.
Does the put-call ratio work for individual stocks?
Yes, but with caveats. Individual stock PCR is noisier than market-wide PCR because a few large trades can distort the ratio. It works best for highly liquid stocks with active options markets (SPY, AAPL, TSLA, etc.). For smaller names, sample size issues make the PCR less reliable.
Can I use the put-call ratio for day trading?
The intraday PCR can provide short-term sentiment cues, but it is volatile and unreliable for individual trades. Intraday PCR is better used as background context (are traders leaning bullish or bearish today?) rather than a direct trading signal. For day trading, focus on price action, volume, and technical indicators.
Disclaimer
This is educational content, not financial advice. Trading involves risk, and you should consult a qualified financial advisor before making any investment decisions. Past performance does not guarantee future results.
Related Articles
12 chapters covering charts, indicators, risk management & more. Plus weekly trading insights.