Implied Volatility: What It Is & How It Affects Options Prices
⚡ Key Takeaways
- Implied volatility represents the market's forward-looking forecast of a stock's expected price movement, expressed as an annualized percentage, and directly determines option prices through the Greek vega.
- IV rank and IV percentile contextualize current volatility relative to its historical range, with readings above 50% favoring option selling strategies and readings below 50% favoring buying strategies.
- IV crush is the rapid collapse of implied volatility after earnings announcements, which can destroy option value even when the stock moves in your favor, making buying options before earnings particularly difficult to profit from.
- Implied volatility historically overestimates actual realized movement about 80-85% of the time, creating a persistent volatility risk premium that forms the foundational edge for option sellers.
- Volatility skew causes out-of-the-money puts to carry higher IV than out-of-the-money calls in equity markets, reflecting investor demand for downside protection and the tendency for stocks to crash faster than they rally.
What Is Implied Volatility?
Implied volatility (IV) is the market's forecast of how much a stock's price is likely to move over a given period. It is expressed as an annualized percentage and is derived from current option prices using pricing models like Black-Scholes.
Unlike historical volatility (which looks backward at actual price movements), implied volatility looks forward. It reflects the collective expectations of all market participants about future uncertainty.
When IV is 30%, the market expects the stock to move roughly 30% up or down over the next year (one standard deviation). For a $100 stock, that translates to an expected range of $70 to $130 over 12 months.
Expected Daily Move ≈ Stock Price × (IV ÷ √252)This formula is incredibly useful. It tells you how much the market expects the stock to move, allowing you to evaluate whether an option's premium is justified.
How IV Affects Option Prices
Implied volatility has a direct and powerful effect on option prices. When IV rises, both calls and puts become more expensive. When IV falls, both become cheaper.
This relationship is captured by the Greek vega. An option with a vega of 0.10 gains $10 per contract for every 1% increase in IV.
| IV Level | ATM Call Price ($100 stock, 30 DTE) | Change from 30% IV |
|---|---|---|
| 15% | $1.80 | -$1.80 |
| 20% | $2.40 | -$1.20 |
| 25% | $3.00 | -$0.60 |
| 30% | $3.60 | Baseline |
| 40% | $4.80 | +$1.20 |
| 50% | $6.00 | +$2.40 |
| 75% | $9.00 | +$5.40 |
Notice that when IV doubles from 25% to 50%, the option price doubles as well. This is why understanding IV is just as important as getting the direction right. You can be correct about the stock's direction and still lose money if IV collapses.
Pro Tip
IV Rank: Contextualizing Volatility
IV rank tells you where current IV stands relative to its range over the past year. It answers the question: "Is IV currently high or low compared to recent history?"
IV Rank = (Current IV − 52-Week IV Low) ÷ (52-Week IV High − 52-Week IV Low) × 100Example: A stock's IV ranges from 20% to 60% over the past year. Current IV is 35%.
IV Rank = (35 − 20) ÷ (60 − 20) × 100 = 37.5%
An IV rank of 37.5% means current IV is relatively low compared to the past year. This would favor buying strategies because options are relatively cheap.
| IV Rank | Interpretation | Favored Strategy |
|---|---|---|
| 0-25% | IV is very low | Buy options (debit spreads, long calls/puts) |
| 25-50% | IV is below average | Slight edge to buying |
| 50-75% | IV is above average | Slight edge to selling |
| 75-100% | IV is very high | Sell options (credit spreads, iron condors) |
IV Percentile: A More Nuanced Measure
IV percentile measures the percentage of trading days over the past year where IV was lower than the current level. It is often more useful than IV rank because it accounts for the distribution of IV values, not just the extremes.
IV Percentile = (Number of Days IV Was Lower Than Today) ÷ (Total Trading Days) × 100If current IV is 35% and IV was below 35% on 200 of the past 252 trading days, the IV percentile is 79.4%. This means IV is higher today than it was on nearly 80% of days in the past year.
The difference between IV rank and IV percentile matters. A stock might have had one extreme spike to 80% IV that lasted only two days, making the IV rank look low even when IV is elevated relative to most days. IV percentile catches this nuance.
Most professional options traders use IV percentile above 50% as a threshold for selling strategies and below 50% for buying strategies.
IV Crush Around Earnings
IV crush is the rapid decline in implied volatility that occurs immediately after a major event, most commonly an earnings announcement. This is one of the most important concepts for options traders to understand.
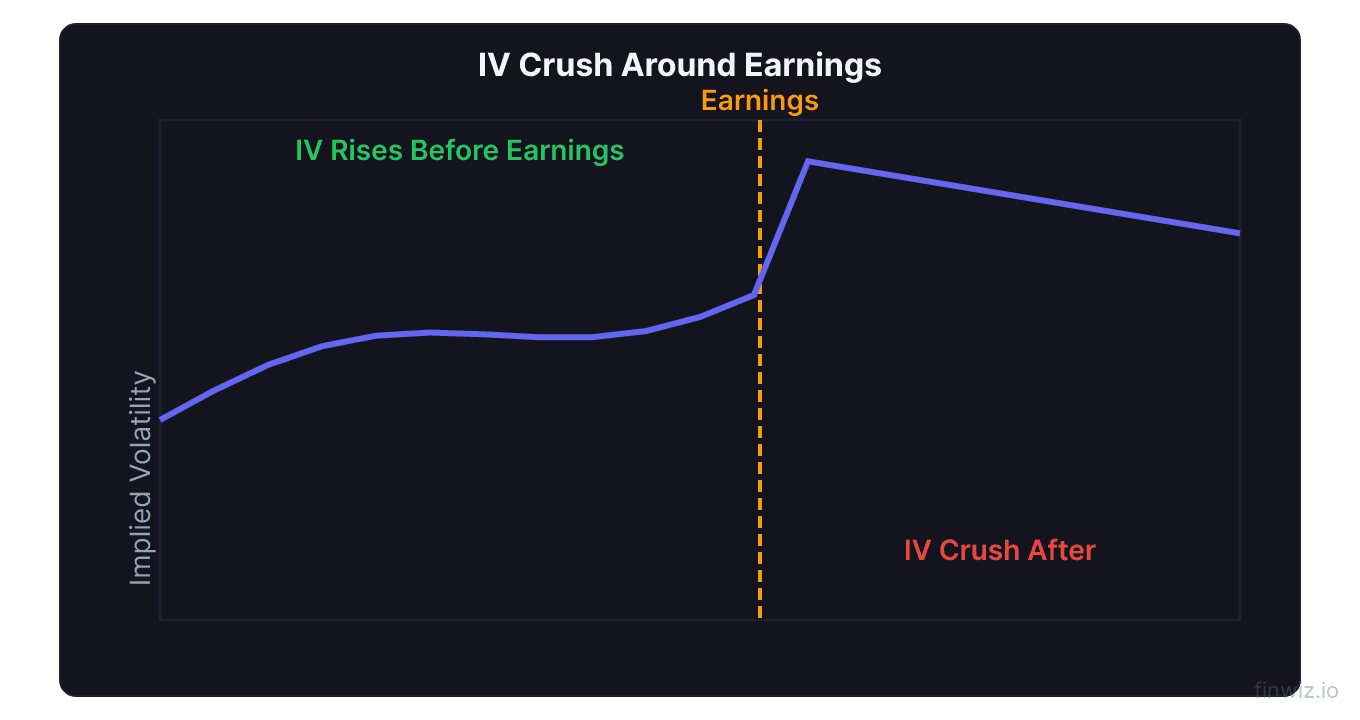
Before earnings, uncertainty is high. Traders do not know whether the company will beat or miss expectations. This uncertainty inflates IV, often dramatically. Once the earnings are released, the uncertainty disappears, and IV collapses — sometimes by 30-60% overnight.
Example of IV crush:
- Stock at $100, normal IV: 30%
- IV before earnings: 55%
- ATM straddle price before earnings: $8.00
- Stock moves 3% to $103 after earnings
- IV after earnings: 28%
- ATM straddle value: $3.20
Even though the stock moved 3%, the straddle lost $4.80 (60%) because the IV collapse destroyed more value than the stock movement created.
| Timing | IV | ATM Call Price | ATM Put Price | Straddle Price |
|---|---|---|---|---|
| 14 days before earnings | 35% | $3.50 | $3.50 | $7.00 |
| 1 day before earnings | 55% | $4.80 | $4.80 | $9.60 |
| 1 day after earnings | 28% | $3.80 | $0.40 | $4.20 |
Pro Tip
Volatility Skew
Volatility skew (also called the volatility smile or smirk) describes the pattern where different strike prices have different implied volatilities, even for the same expiration date.
In equity markets, the skew typically shows higher IV for OTM puts and lower IV for OTM calls. This pattern exists because:
- Investors buy OTM puts for portfolio protection, driving up their prices and IV
- Stocks tend to crash faster than they rally (fear is more intense than greed)
- The 1987 crash demonstrated the need for tail-risk protection, permanently steepening the skew
| Strike (stock at $100) | IV | Reason |
|---|---|---|
| $80 put (20% OTM) | 38% | High demand for crash protection |
| $90 put (10% OTM) | 33% | Moderate protection demand |
| $100 ATM | 28% | Baseline volatility |
| $110 call (10% OTM) | 26% | Lower demand |
| $120 call (20% OTM) | 25% | Lowest demand |
Trading the skew. Some advanced traders exploit skew by selling overpriced OTM puts and buying underpriced OTM calls, or constructing risk reversals (selling a put and buying a call at the same delta). This approach requires a strong understanding of volatility dynamics and careful risk management.
Implied vs. Historical Volatility
Comparing implied volatility to historical (realized) volatility reveals whether options are cheap or expensive:
Volatility Risk Premium = Implied Volatility − Historical VolatilityHistorically, IV overestimates actual realized movement about 80-85% of the time. This is the volatility risk premium — the extra premium option buyers pay for insurance-like protection. This persistent overpricing is the foundational edge for option sellers.
| Relationship | Meaning | Implication |
|---|---|---|
| IV >> HV | Options are very expensive | Strong edge for sellers |
| IV > HV | Options are moderately expensive | Slight edge for sellers |
| IV ≈ HV | Options are fairly priced | No edge either way |
| IV < HV | Options are cheap | Rare; edge for buyers |
How to check: Most options platforms display both IV and HV (usually 20-day or 30-day historical volatility). Compare them to gauge whether options are overpriced or underpriced for the current environment.
How to Trade Implied Volatility
Here are practical strategies based on IV levels:
When IV is high (IV rank above 50%):
- Sell iron condors or credit spreads
- Write covered calls with higher premiums
- Sell strangles or straddles (with defined risk)
- Expect IV to mean-revert downward, helping your short vega positions
When IV is low (IV rank below 50%):
- Buy call options or put options at discounted prices
- Use debit spreads like bull call spreads or bear put spreads
- Buy straddles or strangles to bet on a volatility expansion
- Expect IV to mean-revert upward, helping your long vega positions
Tools for Tracking IV
Several tools and metrics help you monitor implied volatility:
The VIX (CBOE Volatility Index) measures the 30-day implied volatility of S&P 500 options. It is the most widely followed volatility gauge. A VIX below 15 indicates complacency; above 25 signals elevated fear; above 40 indicates panic.
Individual stock IV can be found on any options platform. Look for the IV column in the option chain or the IV chart overlay on the stock chart.
IV rank and percentile are available on platforms like thinkorswim, tastytrade, and many third-party analytics tools. These contextual measures are more useful than raw IV numbers.
Term structure shows IV across different expirations. When near-term IV is higher than longer-term IV (backwardation), it signals acute fear or an upcoming event.
Frequently Asked Questions
What causes implied volatility to change?
IV changes based on supply and demand for options. When traders aggressively buy options (usually puts for protection), IV rises. When option selling dominates, IV falls. Major catalysts for IV changes include earnings announcements, economic data releases, geopolitical events, and shifts in market sentiment.
Can implied volatility be used to predict stock direction?
Not directly. IV tells you how much the market expects a stock to move, not which direction. However, extreme IV levels can signal turning points. Very high IV often coincides with market bottoms (maximum fear), while very low IV often precedes volatility expansions. The put-call ratio is a better tool for gauging directional sentiment.
Why is IV usually higher than historical volatility?
The difference is called the volatility risk premium. Option buyers are willing to pay extra for protection against worst-case scenarios, just as homeowners pay more for insurance than the expected cost of claims. This systematic overpricing of options is the primary reason selling premium is profitable over time.
How does IV crush affect different strategies?
Long options (buying calls/puts) are hurt by IV crush because their vega is positive. Short options (selling calls/puts, iron condors) benefit from IV crush because their vega is negative. Spreads reduce but do not eliminate IV crush exposure. The wider the spread, the more net vega you carry.
What is a good IV rank for selling options?
Most professional options sellers look for an IV rank above 50% before entering a trade. An IV rank above 70% provides an even stronger edge because it means current IV is near the top of its recent range and is likely to mean-revert downward. Always combine IV analysis with other factors like the stock's technical setup and upcoming events.
Disclaimer
This is educational content, not financial advice. Trading involves risk, and you should consult a qualified financial advisor before making any investment decisions. Past performance does not guarantee future results.
Related Articles
12 chapters covering charts, indicators, risk management & more. Plus weekly trading insights.