How to Read an Option Chain: A Visual Walkthrough
⚡ Key Takeaways
- An option chain displays all available options contracts for a stock, organized by expiration date and strike price
- The bid-ask spread reveals liquidity — tighter spreads mean lower trading costs
- Volume shows how many contracts traded today, while open interest shows total outstanding contracts
- The Greeks columns (delta, gamma, theta, vega) help you evaluate risk before entering a trade
- Reading an option chain efficiently is a foundational skill every options trader must develop
What Is an Option Chain?
An option chain (also called an option matrix or option board) is a table that displays all available options contracts for a specific stock or ETF. It shows every available strike price and expiration date, along with key data points like price, volume, and the Greeks.
Think of the option chain as a menu at a restaurant. It lists everything you can buy or sell, along with the prices. Learning to read this menu efficiently is one of the first skills every options trader needs to develop.
Most option chains are organized with calls on the left and puts on the right, separated by a column of strike prices in the center. The strikes highlighted or shaded differently indicate which options are in the money versus out of the money.
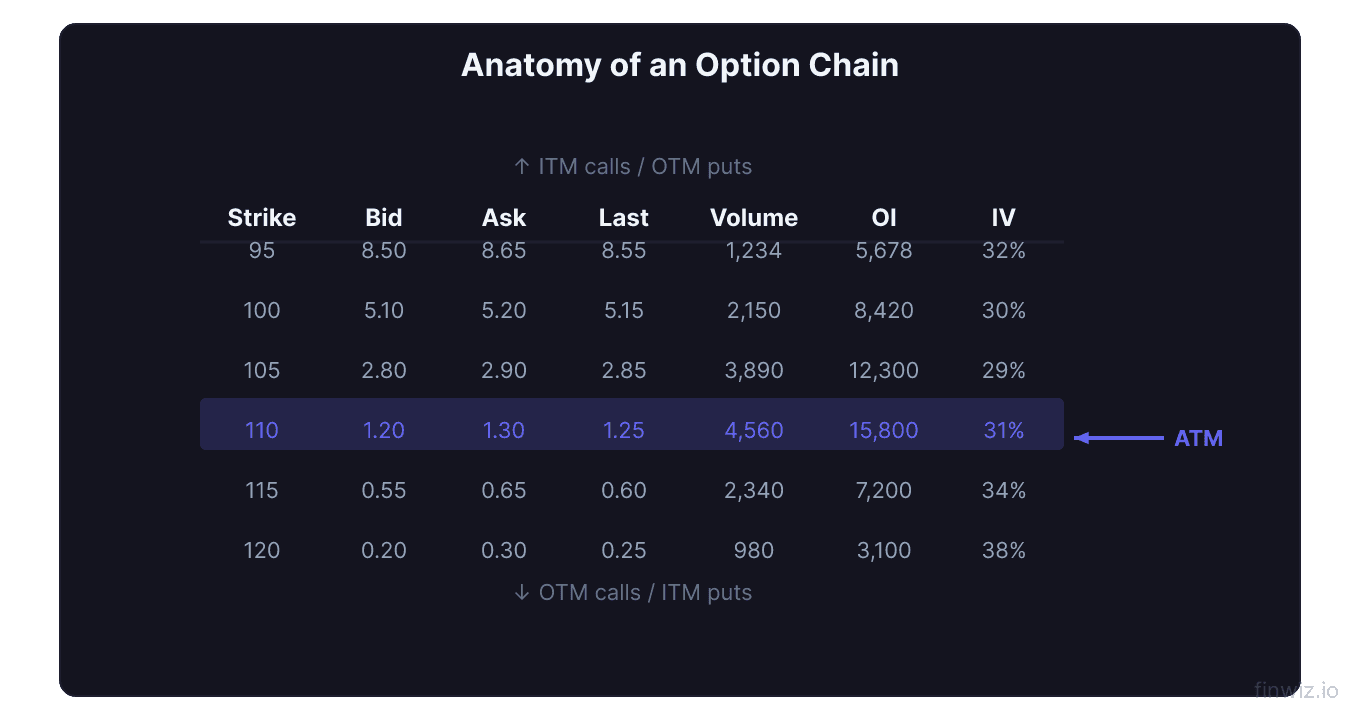
Anatomy of an Option Chain
Here is a simplified option chain for stock XYZ trading at $100, showing the 30-day expiration:
Calls:
| Bid | Ask | Last | Volume | OI | Delta | Strike |
|---|---|---|---|---|---|---|
| $11.80 | $12.20 | $12.00 | 450 | 3,200 | 0.88 | $90 |
| $7.40 | $7.70 | $7.55 | 1,200 | 8,500 | 0.72 | $95 |
| $3.40 | $3.60 | $3.50 | 5,800 | 22,000 | 0.50 | $100 |
| $1.20 | $1.35 | $1.28 | 3,400 | 15,000 | 0.28 | $105 |
| $0.35 | $0.45 | $0.40 | 1,800 | 9,000 | 0.12 | $110 |
Puts:
| Strike | Delta | OI | Volume | Last | Ask | Bid |
|---|---|---|---|---|---|---|
| $90 | -0.12 | 4,100 | 600 | $0.30 | $0.40 | $0.30 |
| $95 | -0.28 | 11,000 | 2,100 | $1.15 | $1.25 | $1.10 |
| $100 | -0.50 | 18,500 | 4,200 | $3.30 | $3.50 | $3.30 |
| $105 | -0.72 | 6,800 | 900 | $6.20 | $6.50 | $6.20 |
| $110 | -0.88 | 2,500 | 350 | $10.80 | $11.20 | $10.80 |
The shaded rows (above $100 for calls, below $100 for puts) represent in-the-money options.
Understanding Bid, Ask, and Spread
The bid is the highest price a buyer is willing to pay. The ask is the lowest price a seller is willing to accept. The difference between them is the bid-ask spread.
Bid-Ask Spread = Ask Price − Bid PriceThe bid-ask spread is a hidden cost of trading options. When you buy at the ask and later sell at the bid, you lose the spread immediately. This is why liquidity matters.
| Spread Width | Liquidity Level | Typical Underlying |
|---|---|---|
| $0.01-$0.05 | Excellent | SPY, QQQ, AAPL |
| $0.05-$0.20 | Good | Large-cap stocks |
| $0.20-$0.50 | Moderate | Mid-cap stocks |
| $0.50-$2.00 | Poor | Small-cap, low-volume stocks |
| $2.00+ | Very poor | Illiquid options, avoid |
Pro Tip
Volume: Today's Trading Activity
Volume shows the number of contracts traded during the current session. High volume indicates active trading interest in that specific strike and expiration.
Why volume matters:
- High volume means tighter spreads, easier fills, and lower transaction costs
- Low volume means wider spreads, potential slippage, and difficulty exiting positions
- Unusual volume can signal institutional activity or informed trading (see unusual options activity)
Volume is particularly important for multi-leg strategies like iron condors or spreads. If the individual legs have low volume, getting filled on a multi-leg order at a reasonable price becomes difficult.
Volume spikes deserve attention. If a stock normally trades 500 call contracts per day and suddenly trades 5,000, something has changed. This could indicate insider buying, an upcoming catalyst, or institutional positioning.
Open Interest: Outstanding Contracts
Open interest (OI) is the total number of outstanding option contracts that have not been closed, exercised, or expired. Unlike volume, which resets daily, open interest accumulates over time.
How open interest works:
- When a new buyer and a new seller create a contract, OI increases by 1
- When an existing holder sells to another new buyer, OI stays the same
- When both sides of a contract close their positions, OI decreases by 1
Why OI matters:
- High OI indicates a liquid contract with many market participants
- Low OI suggests limited interest and potential liquidity problems
- Rising OI with rising price confirms a trend (new money entering)
- Rising OI with falling price suggests aggressive selling or hedging
- Falling OI indicates positions are being closed (unwinding)
| OI Level | Interpretation | Trading Implication |
|---|---|---|
| 1,000+ | Very liquid | Easy to trade, tight spreads |
| 500-1,000 | Liquid | Generally tradable |
| 100-500 | Moderate | Use limit orders carefully |
| Below 100 | Illiquid | Avoid or use extreme caution |
The max pain theory suggests that stocks tend to gravitate toward the strike price with the highest open interest at expiration, as this is the level where the most options expire worthless. While not always reliable, it provides an interesting reference point.
The Greeks Columns
Most option chains display the Greeks alongside price data. Here is what to look for:
Delta — Shows your directional exposure per contract. A 0.50 delta call moves $0.50 for every $1 stock move. Use delta to estimate your probability of profit and to size positions. Most traders select strikes based on delta (e.g., "sell the 16-delta put").
Gamma — Shows how quickly delta changes. High gamma near ATM strikes means the option's behavior can shift rapidly. Important for short-term traders and those near expiration.
Theta — Shows daily time decay in dollars. A theta of -0.05 means the option loses $5 per contract per day. Critical for option sellers who rely on time decay for profits.
Vega — Shows sensitivity to implied volatility changes. A vega of 0.10 means the option gains $10 for every 1% increase in IV. Important for evaluating whether options are cheap or expensive.
Expiration Selection on the Chain
Option chains allow you to filter by expiration date. Most platforms display a dropdown or tab bar showing available expirations:
- Weekly expirations — Every Friday (and sometimes Monday/Wednesday for popular names)
- Monthly expirations — Third Friday of each month
- Quarterly expirations — End of each calendar quarter
- LEAPS — January expirations 1-2+ years out
Choosing the right expiration depends on your strategy:
| Strategy | Ideal Expiration | Reason |
|---|---|---|
| Day trading options | 0-7 DTE | Maximum gamma, cheapest premium |
| Swing trading (buying) | 30-60 DTE | Balance of cost and time |
| Selling premium | 30-45 DTE | Optimal theta decay curve |
| Stock replacement | 6-12 month LEAPS | Minimal time decay, high delta |
| Hedging portfolio | 60-90 DTE | Enough time without overpaying |
Pro Tip
Filtering and Analyzing the Chain
Experienced traders use several techniques to quickly analyze an option chain:
Focus on the ATM strikes first. The ATM strike tells you the "baseline" premium, volume, and Greeks. Everything else is relative to this reference point.
Compare bid-ask spreads across strikes. If the spread on one strike is much wider than its neighbors, liquidity may be thin at that strike.
Look for unusual activity. Compare today's volume to open interest. A volume-to-OI ratio above 1.0 suggests unusual trading activity. Check whether the activity is on the bid (selling) or the ask (buying) to determine direction.
Check put-call volume ratios. Heavy call buying relative to puts signals bullish sentiment. Heavy put buying signals bearish sentiment or hedging. The put-call ratio is a formalized version of this analysis.
Evaluate the term structure. Compare IV across expirations. If near-term IV is much higher than longer-term IV, an event (like earnings) is approaching and creating a volatility premium.
Common Option Chain Mistakes
Trading illiquid options. The biggest mistake beginners make is buying options with wide bid-ask spreads. A $0.50 spread on a $2.00 option means you lose 25% the moment you enter the trade.
Ignoring open interest. Low OI means you may struggle to exit your position at a fair price. Always check OI before entering a trade, especially for multi-leg strategies.
Using market orders. Never use market orders for options. The bid-ask spread can widen without notice, and you may get filled at a terrible price. Always use limit orders.
Overlooking the Greeks. Entering a trade without checking theta means you do not know how much the position costs you each day. Ignoring vega means you could be buying expensive options that are primed for an IV crush.
Focusing only on the cheapest options. Far OTM options are cheap for a reason — they have a very low probability of profit. Do not buy $0.10 options hoping for a lottery win. The delta on these options is typically below 0.05, meaning there is less than a 5% chance of profit.
Frequently Asked Questions
What is the best platform for viewing option chains?
The most popular platforms for option chain analysis include thinkorswim (Charles Schwab), tastytrade, Interactive Brokers TWS, and Fidelity Active Trader Pro. All display comprehensive chain data including Greeks, IV, volume, and OI. The best platform is the one you find most intuitive and that provides the data you need.
How do I know if an option is liquid enough to trade?
Check three things: bid-ask spread (under $0.20 for most stocks), volume (at least 100 contracts for the day), and open interest (at least 500 outstanding contracts). If all three criteria are met, the option is generally liquid enough for retail traders.
Why do different strikes have different implied volatilities?
This is called volatility skew. OTM puts typically have higher IV than ATM or OTM calls because of demand for downside protection. Learn more about this phenomenon in our implied volatility guide.
What does it mean when volume exceeds open interest?
When daily volume exceeds open interest, it means more contracts were traded in a single day than currently exist. This indicates extremely unusual activity — typically large institutional orders. This can signal that informed traders expect a significant move. See our guide on unusual options activity for more details.
Should I always trade the most active expiration?
Not necessarily. The most active expiration is usually the nearest monthly, but your strategy dictates your expiration. If you are buying options, you may want a longer-dated expiration to reduce time decay. If you are selling, the 30-45 DTE range may be more appropriate regardless of which expiration has the highest volume.
Disclaimer
This is educational content, not financial advice. Trading involves risk, and you should consult a qualified financial advisor before making any investment decisions. Past performance does not guarantee future results.
Related Articles
12 chapters covering charts, indicators, risk management & more. Plus weekly trading insights.