Unusual Options Activity: How to Spot & Trade Smart Money Bets
⚡ Key Takeaways
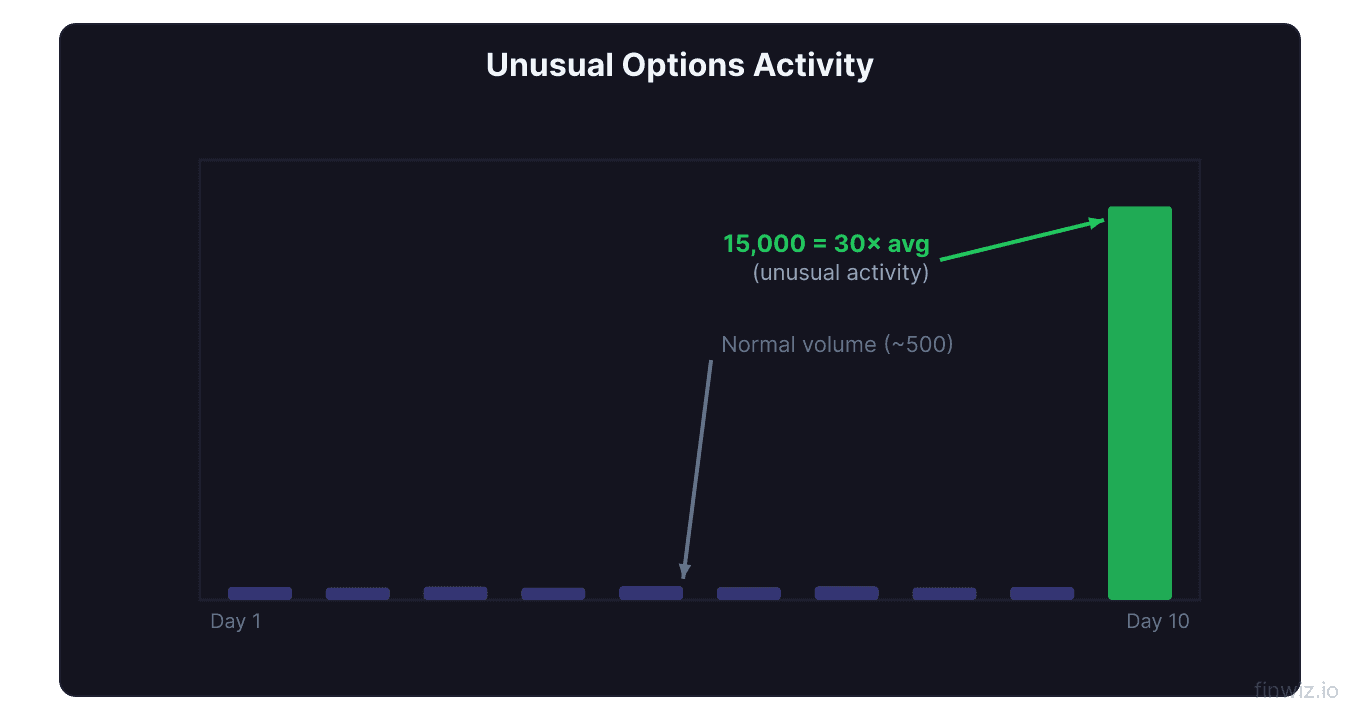
- Unusual options activity (UOA) occurs when option volume significantly exceeds normal levels, often signaling institutional positioning
- Sweeps are aggressive orders that hit multiple exchanges simultaneously, indicating urgency and conviction
- Block trades are large single-fill orders typically executed by institutional traders
- Following smart money blindly is risky — always analyze context, including whether the trade is opening or closing
- The best UOA signals combine high volume, near-term expiration, and activity that aligns with the technical picture
What Is Unusual Options Activity?
Unusual options activity (UOA) refers to options trading volume that is significantly higher than normal for a particular stock, strike price, or expiration. When a stock that normally trades 500 options per day suddenly sees 10,000 contracts change hands, something unusual is happening.
UOA matters because the options market is where institutional traders, hedge funds, and informed insiders often place their bets. Large option trades can signal that someone with significant capital — and potentially significant information — expects a big move in the stock.
Tracking UOA is sometimes called "following the smart money" or "following the flow." While not every unusual trade is profitable, the collective signal from institutional options activity can provide a meaningful edge.
Why Options Reveal Institutional Intent
Institutions prefer options over stock for several reasons, and these reasons are why UOA is so informative:
Leverage. A $1 million options bet controls far more stock exposure than $1 million in shares. This amplifies returns on high-conviction ideas.
Defined risk. Buying calls or puts limits the institution's loss to the premium, even on a speculative trade.
Anonymity (partial). While large stock purchases must be disclosed (13D filings), options positions have different reporting requirements and can be harder to trace to specific funds.
Timing signals. The expiration date of the options reveals when the institution expects the move. If someone buys thousands of calls expiring in two weeks, they expect the catalyst soon. If they buy LEAPS, the thesis is longer-term.
| Signal | What It Tells You |
|---|---|
| Heavy call buying | Bullish positioning |
| Heavy put buying | Bearish positioning or hedging |
| Near-term expiration | Imminent catalyst expected |
| Long-term expiration | Longer-term thesis |
| Large premium spent | High conviction |
| Activity at unusual strikes | Specific price target |
Sweeps vs. Block Trades
Not all large trades are created equal. The execution method reveals how urgently the trader wants to get filled.
Sweeps
A sweep is an order that simultaneously hits multiple exchanges to fill as quickly as possible. The trader is willing to pay different prices across exchanges rather than waiting for a single fill at the best price. This signals urgency and conviction.
Why sweeps matter:
- The trader is prioritizing speed over price efficiency
- They likely have time-sensitive information or strong conviction
- Sweeps at the ask price (paying the full ask) are the most bullish signal for calls
- Sweeps at the bid price (hitting the bid on puts) suggest aggressive bearish positioning
Block Trades
A block trade is a single large order (typically 100+ contracts) that fills all at once. These are negotiated between institutional participants, often through a broker's block trading desk.
Why blocks matter:
- They represent large capital commitments from a single entity
- Blocks are often institutional hedges or core positions
- A block trade on an unusual strike far from the current price can signal a specific price target
| Feature | Sweep | Block |
|---|---|---|
| Execution | Multiple exchanges, simultaneous | Single exchange, one fill |
| Speed priority | Very high | Moderate |
| Conviction signal | Strong (urgency) | Strong (size) |
| Typical size | Medium to large | Large |
| Frequency | Common in active names | Less common |
Pro Tip
How to Identify Unusual Options Activity
Several criteria help distinguish genuinely unusual activity from normal trading noise:
Volume-to-open-interest ratio. When daily volume exceeds open interest, new positions are being created. A ratio above 2.0 is very unusual. Check this on the option chain.
Volume relative to average. Compare today's volume to the 20-day average volume for that stock's options. Activity that is 3x or more the average is considered unusual.
Premium size. The total dollar amount spent matters. 1,000 contracts at $0.10 ($10,000 total) is less meaningful than 200 contracts at $5.00 ($100,000 total). Focus on trades with significant capital behind them.
Trade direction. Was the trade executed at the ask (buyer-initiated, bullish for calls) or at the bid (seller-initiated, bearish for calls)? The trade's position relative to the bid-ask midpoint reveals the aggressor's intent.
Timing relative to events. UOA that appears 1-3 days before an earnings announcement, FDA decision, or M&A announcement is the most informative.
Analyzing UOA: A Step-by-Step Process
When you spot unusual options activity, follow this process before acting:
Step 1: Determine if it is opening or closing.
- If volume > open interest, the trade is likely opening (new position). This is more meaningful.
- If volume < open interest, the trade could be closing (exiting). This is less informative.
Step 2: Identify the likely strategy.
- Is it a single-leg trade (directional bet)?
- Is it part of a spread (volume appears at two strikes simultaneously)?
- Is it a hedge against a stock position?
Step 3: Assess the risk taken.
- How much total premium was spent?
- What expiration was chosen?
- How far OTM are the options?
Step 4: Check the technical picture.
- Does the UOA align with the stock's technical setup?
- Is the stock near support or resistance?
- What does the RSI indicate?
Step 5: Look for confirmation.
- Is there UOA in the same direction across multiple expirations?
- Are other stocks in the sector showing similar activity?
- Do the fundamentals support the direction of the bet?
Real-World Example: Following Smart Money
Company ABC trades at $45. You notice the following unusual activity:
| Time | Strike | Expiration | Volume | OI | Premium | Type |
|---|---|---|---|---|---|---|
| 10:02 AM | $50 call | 21 DTE | 2,500 | 300 | $0.85 | Sweep, at ask |
| 10:05 AM | $50 call | 21 DTE | 1,800 | 300 | $0.90 | Sweep, at ask |
| 10:12 AM | $55 call | 21 DTE | 1,200 | 150 | $0.35 | Block, at ask |
Analysis:
- Combined volume of 5,500 contracts vs. OI of 300-450 — these are overwhelmingly new positions
- All executed at the ask — aggressive buying
- Total premium spent: (2,500 × $0.85) + (1,800 × $0.90) + (1,200 × $0.35) = $4,165 per contract, $416,500 total
- 21 DTE — the buyer expects a catalyst within 3 weeks
- $50 and $55 strikes are 11% and 22% above current price — the buyer expects a significant move
This pattern strongly suggests someone with conviction (and $400K+) is positioning for a major upside move in ABC within three weeks. Possible catalysts: earnings, M&A news, contract award, or FDA approval.
Common Pitfalls of Following UOA
Mistake 1: Assuming all large trades are bullish. A large block of calls could be a sell (writing calls against a stock position). Always check whether the trade was at the bid (selling) or ask (buying).
Mistake 2: Ignoring that the trade might be a hedge. An institution that owns 1 million shares might buy 10,000 puts as a portfolio hedge. This is not a bearish bet — it is insurance. Without knowing the full portfolio, you cannot determine the trader's true directional view.
Mistake 3: Copying the exact trade. Institutional traders have much larger accounts, longer time horizons, and different risk management than retail traders. Copying their exact strike and expiration without considering your own risk tolerance often leads to poor results.
Mistake 4: Not considering the spread. If volume appears at two strikes simultaneously (e.g., heavy buying at $50 calls and heavy selling at $55 calls), the trader is likely putting on a bull call spread, not a directional call bet. The spread changes the risk-reward profile entirely.
Mistake 5: Acting on stale data. By the time UOA appears on scanning tools and social media, the opportunity may have passed. Options prices adjust quickly to large flows. If the calls already jumped 50% after the sweep, your entry is significantly worse than the institution's.
Tools for Tracking UOA
Several platforms and services track unusual options activity in real time:
| Tool | Features | Cost |
|---|---|---|
| CBOE options data | Official exchange data, delayed | Free |
| Unusual Whales | Real-time flow, filters, alerts | Subscription |
| Cheddar Flow | Sweep/block identification, sector flow | Subscription |
| Barchart | UOA scanner, volume analysis | Free/paid tiers |
| Your brokerage platform | Option chain with volume/OI data | Included |
Most brokerage platforms show volume and open interest in the option chain, allowing you to identify unusual activity manually. Dedicated tools add features like trade direction (at bid/ask), multi-leg detection, and historical flow analysis.
Building a UOA Trading Process
Here is a structured approach to incorporating UOA into your trading:
- Screen daily for stocks with options volume 3x+ their 20-day average
- Filter for trades with $100K+ in total premium
- Analyze whether trades are opening or closing (volume vs. OI)
- Check direction — sweeps at ask (aggressive) vs. trades at bid (passive)
- Evaluate the technical setup — does price action support the direction?
- Size appropriately — risk no more than 1-2% of your account on any UOA-based trade
- Set clear exit rules — take profits at 50-100% and cut losses at 50%
- Track results — log every UOA trade to determine which patterns work best for you
Pro Tip
Frequently Asked Questions
Does unusual options activity indicate insider trading?
Not necessarily. While some UOA may be driven by material non-public information (which is illegal), most unusual activity comes from legitimate sources: institutional portfolio adjustments, hedge fund speculative positions, sector rotation trades, and algorithmic strategies. Regulators monitor unusual activity before major announcements, but proving insider trading requires evidence beyond just the trade itself.
How quickly should I act on unusual options activity?
Speed matters. Options prices adjust rapidly after large flows. If you see a large sweep, the underlying stock and related options often move within minutes. However, chasing the initial spike is risky. Look for a pullback or confirmation before entering, and never pay significantly more than the sweep's average fill price.
Is it better to follow call or put UOA?
Both can be valuable, but call buying UOA has historically been slightly more reliable for retail traders to follow. This is partly because institutional put buying is often hedging (not directional), while institutional call buying is more likely a speculative position. That said, context matters more than the option type.
Can market makers' activity create false UOA signals?
Yes. Market makers trade large volumes as part of their function, and their activity can create misleading UOA signals. Market maker trades are typically spread or hedge-related, not directional bets. Dedicated UOA tools filter out identified market maker activity, but some still slips through.
What percentage of UOA trades are profitable to follow?
There is no definitive statistic, as results depend heavily on how you filter, enter, and manage the trades. Generally, UOA signals that combine large premium, near-term expiration, opening trades at the ask, and confirming technical setups have a win rate in the 55-65% range. This is a modest edge that requires disciplined risk management to be profitable over time.
Disclaimer
This is educational content, not financial advice. Trading involves risk, and you should consult a qualified financial advisor before making any investment decisions. Past performance does not guarantee future results.
Related Articles
12 chapters covering charts, indicators, risk management & more. Plus weekly trading insights.