Support and Resistance: How to Identify Key Price Levels
⚡ Key Takeaways
- Support is a price level where buying pressure prevents further decline; resistance is where selling pressure caps advances
- Horizontal support and resistance levels are drawn from prior highs and lows where price has reacted multiple times
- Diagonal support and resistance form along trend lines connecting swing highs or swing lows
- Role reversal occurs when broken support becomes resistance and broken resistance becomes support
- The more times a level is tested, the more significant it becomes, but eventually all levels break
What Are Support and Resistance?
Support and resistance are the two most fundamental concepts in technical analysis. They represent price levels where the balance between buyers and sellers shifts, creating predictable zones of interest on any stock chart.
Support is a price level where demand is strong enough to absorb selling pressure and prevent the price from falling further. Think of it as a floor beneath the stock. Each time the price approaches this level, buyers step in.
Resistance is the opposite. It is a price ceiling where supply overwhelms demand, preventing the price from moving higher. Sellers consistently appear at this level, pushing the price back down.
Understanding these levels allows you to identify high-probability entry and exit points, set logical stop losses, and anticipate where price may pause or reverse.
How to Identify Horizontal Support and Resistance
Horizontal support and resistance are the simplest and most widely used types. They are drawn as horizontal lines on the chart at price levels where the stock has previously reversed direction.
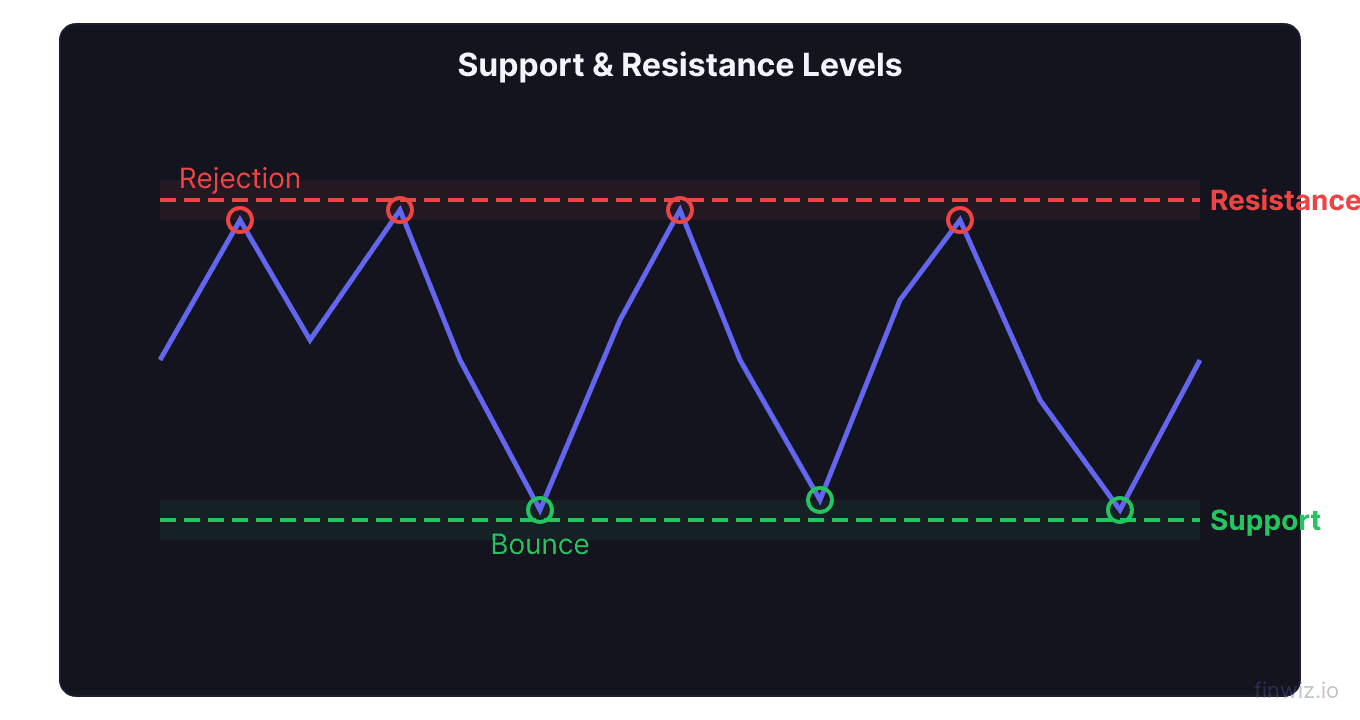
To identify horizontal support, look for areas where the price has bounced upward at least twice from roughly the same price zone. The more touches a level has, the more significant it becomes.
To identify horizontal resistance, look for price zones where the stock has been rejected downward multiple times. These are levels where sellers have historically been willing to take profits or initiate short positions.
Key principles for drawing horizontal levels:
- Focus on zones rather than exact prices. Support and resistance are rarely a single penny; they are areas.
- Use closing prices as your primary reference, but note wicks as well.
- Higher timeframe levels carry more weight than lower timeframe levels.
- Levels with high volume at the turn are more significant.
Pro Tip
Diagonal Support and Resistance
Not all support and resistance is horizontal. Diagonal support follows an ascending trend line connecting higher swing lows in an uptrend. Diagonal resistance follows a descending trend line connecting lower swing highs in a downtrend.
Diagonal levels are essentially trend lines. An ascending support line shows that buyers are willing to pay progressively higher prices, reflecting increasing demand. A descending resistance line shows sellers are willing to accept progressively lower prices, reflecting increasing supply.
Diagonal levels require at least two touches to draw, but they become truly validated with three or more touches. The more touches, the more traders are watching that line, and the more significant the eventual break will be.
Channels form when you can draw both a diagonal support line and a parallel diagonal resistance line. Stocks that trade within a channel offer clean swing trading opportunities: buy near the bottom of the channel, sell near the top.
Role Reversal: When Support Becomes Resistance
One of the most powerful concepts in technical analysis is role reversal. When a support level breaks, it frequently becomes resistance. When a resistance level breaks, it often becomes support.
This happens because of market psychology. Traders who bought at support and watched the price fall below their entry are anxious to sell at breakeven if the price returns to that level. This selling pressure turns old support into new resistance.
Conversely, traders who sold at resistance and watched the price break above it regret selling too early. If the price pulls back to that level, they buy, turning old resistance into new support.
Role reversal setups are among the highest-probability trades in technical analysis. Here is the pattern:
- A stock breaks through a significant resistance level on strong volume.
- After the breakout, the price pulls back to the broken resistance level.
- The old resistance holds as new support.
- This pullback to the new support is an entry opportunity.
The Significance of Multiple Touches
A support or resistance level that has been tested three or more times is considered well-established. Each successful test proves that buyers or sellers are present at that level.
However, there is an important nuance. While multiple tests validate a level, each test also weakens it slightly. Every time the price bounces off support, some of the buyers at that level get filled. Over time, there are fewer resting orders at that price, and the level becomes more vulnerable to a break.
This is why experienced traders pay close attention to how the price reacts at key levels. If each bounce becomes shallower, or if volume on the bounce decreases, the level is losing strength and a breakdown may be imminent.
Support and Resistance Trading Strategies
The Bounce Trade
The bounce trade involves buying at support or selling at resistance. This strategy works best in range-bound markets where the stock is oscillating between clearly defined levels.
Entry rules for a bounce trade:
- Wait for the price to reach the support or resistance zone.
- Look for a confirmation candle (such as a hammer at support or a shooting star at resistance).
- Place your stop loss just beyond the support or resistance zone.
- Set your profit target at the opposite level of the range.
The Breakout Trade
The breakout trade involves entering a position when price breaks through support or resistance with conviction. This strategy works best when a stock has been consolidating near a level for an extended period.
Entry rules for a breakout trade:
- Wait for a decisive close beyond the support or resistance level.
- Confirm with above-average volume.
- Enter on the breakout candle or on the first pullback to the broken level (role reversal).
- Place your stop loss on the other side of the broken level.
The Role Reversal Trade
As described above, this strategy combines elements of both bounces and breakouts. You wait for a breakout, then enter on the pullback to the broken level when it confirms role reversal. This gives you a better risk-to-reward ratio than entering on the initial breakout.
Pro Tip
Round Numbers as Psychological Support and Resistance
Round numbers like $50, $100, and $200 often act as support and resistance even without prior price history at those levels. This happens because traders and algorithms place orders at round numbers more frequently.
These psychological levels are especially important for widely followed stocks and major indices. Watch how stocks behave around these levels, and you will notice they frequently pause, consolidate, or reverse.
Moving Averages as Dynamic Support and Resistance
Unlike static horizontal lines, moving averages act as dynamic support and resistance that changes with each new price bar. The 50-day and 200-day simple moving averages are the most watched.
In an uptrend, the price often finds support at its key moving averages during pullbacks. In a downtrend, the price often encounters resistance when it rallies back to a declining moving average.
Common Mistakes When Using Support and Resistance
- Drawing too many lines: If every price level is marked, none of them are useful. Focus on the most significant levels where price has reacted strongly and repeatedly.
- Treating levels as exact prices: Support and resistance are zones, not single price points. Allow some buffer in your analysis.
- Ignoring the trend: Support is more likely to hold in an uptrend. Resistance is more likely to hold in a downtrend. Trading against the trend at these levels increases your failure rate.
- Not using stop losses: Even the strongest support and resistance levels break eventually. Always define your risk.
Frequently Asked Questions
How do I know if a support or resistance level will hold?
No one can know for certain whether a level will hold. However, several clues increase the probability. Look for declining volume on the approach to the level, a confirmation candle at the level, and alignment with the higher timeframe trend. If the RSI is oversold at support or overbought at resistance, the odds of a bounce increase.
What happens when support or resistance breaks?
When support breaks, it often leads to accelerated selling as stop losses trigger and shorts pile on. The old support then frequently becomes new resistance through role reversal. When resistance breaks, the opposite occurs: buying accelerates, and the old resistance becomes new support.
Should I use closing prices or wicks to define levels?
Both matter, but give closing prices more weight. A wick that briefly penetrates a level but closes back inside is less significant than a close beyond the level. However, wicks show you the extremes that traders are willing to pay, so they help define the boundaries of a support or resistance zone.
How many times does a level need to be tested to be valid?
A minimum of two touches is required to identify a level, and three or more touches make it highly significant. However, remember that each touch slightly weakens the level. If you see five or six touches with progressively weaker bounces, the level is likely about to break.
Can I use support and resistance for any asset?
Yes. Support and resistance apply to stocks, ETFs, futures, forex, and cryptocurrencies. The concepts are universal because they reflect human psychology around specific price levels, not anything specific to one asset class.
Disclaimer
This is educational content, not financial advice. Trading involves risk, and you should consult a qualified financial advisor before making any investment decisions. Past performance does not guarantee future results.
Related Articles
12 chapters covering charts, indicators, risk management & more. Plus weekly trading insights.