Breakout Trading: How to Trade Price Breakouts Profitably
⚡ Key Takeaways
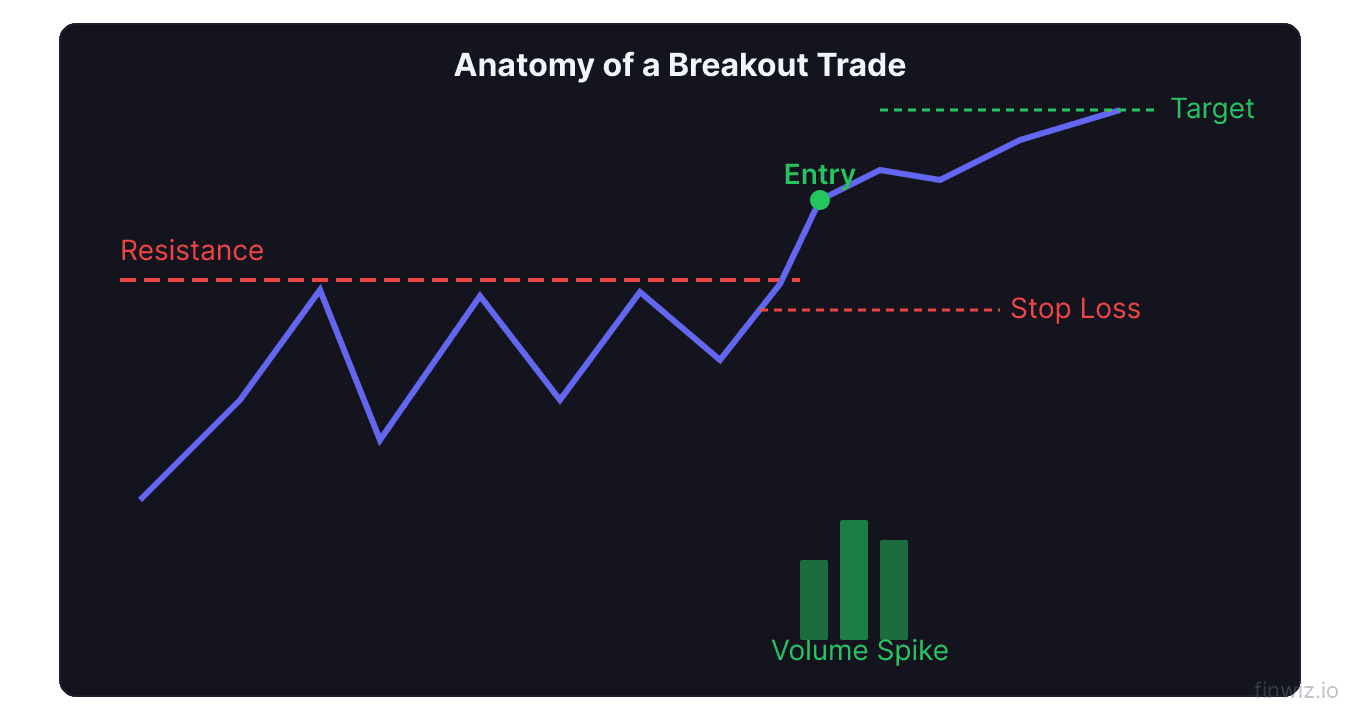
- A breakout occurs when price moves decisively beyond a defined support or resistance level with increased volume
- Volume confirmation is the single most important factor in distinguishing real breakouts from false ones
- False breakouts are common and can be avoided by waiting for a close beyond the level and volume confirmation
- Entry strategies include buying on the breakout candle, buying on the retest, or buying on the first pullback
- Stop losses should be placed just inside the broken level, and targets can be projected using the pattern height
What Is Breakout Trading?
Breakout trading is a strategy that involves entering a position when the price moves beyond a defined level of support or resistance with enough force to suggest a sustained move in that direction.
Breakouts signal a shift in supply and demand. When a stock breaks above resistance, it means demand has overwhelmed the sellers who were defending that level. When it breaks below support, supply has overwhelmed the buyers.
The appeal of breakout trading is that it positions you at the very beginning of a new move. If the breakout is genuine, the stock can travel a significant distance in a short period. The challenge is that false breakouts are common, and without proper filtering, you can accumulate losses on failed signals.
Identifying Breakout Setups
Not all price levels produce meaningful breakouts. The best breakout setups share specific characteristics that increase the probability of follow-through.
Consolidation Before the Breakout
The most reliable breakouts emerge from periods of tight consolidation. When a stock trades in a narrow range for an extended period, it means buyers and sellers are in equilibrium. The longer and tighter the consolidation, the more explosive the eventual breakout tends to be.
Look for these consolidation patterns:
- Flat bases: The stock trades sideways within a narrow range near resistance
- Ascending triangles: Higher lows form against flat resistance, showing buyers becoming more aggressive
- Symmetrical triangles: Both highs and lows compress toward a point, showing decreasing volatility
- Bull flags: A brief, narrow pullback follows a strong move up, forming a flag shape
Well-Defined Levels
The support or resistance level being broken should be clearly defined and widely watched. A level that has been tested three or more times is more significant. The more traders are watching a level, the more orders cluster around it, and the more powerful the reaction when it breaks.
Declining Volume During Consolidation
Before a breakout, volume typically contracts. This dry-up volume shows that the market is quiet and coiled. When volume suddenly surges on the breakout, it creates a stark contrast that confirms the move.
Pro Tip
Volume Confirmation
Volume is the most critical breakout filter. Without volume confirmation, a breakout is suspect.
A genuine breakout should meet these volume criteria:
- The breakout candle should have volume that is 1.5 to 2 times or more the 20-day average volume
- Volume should be the highest in the consolidation period
- In the days following the breakout, pullback candles should have lower volume than the breakout candle
- When the price resumes in the breakout direction, volume should pick up again
If a stock crosses above resistance on volume that is average or below average, it is likely a false breakout. The lack of participation means there is not enough conviction behind the move to sustain it.
Use relative volume (RVOL) to quickly assess whether the volume on a breakout is significant. An RVOL of 2.0 or higher on the breakout candle is a strong confirmation signal.
False Breakouts: How to Avoid Them
False breakouts, also called fakeouts, occur when the price briefly moves beyond a level but then reverses back inside the range. They are one of the most frustrating experiences in trading, but they can be minimized with proper filters.
Why False Breakouts Happen
- Stop-loss hunting: Large players push the price beyond a level to trigger stop losses, then reverse the move to fill orders at better prices.
- Low-volume breaks: Without genuine buying interest, the price cannot sustain above the level and falls back.
- News-driven spikes: A temporary reaction to news pushes the price past a level, but the fundamentals do not support the move.
Filters to Reduce False Breakouts
- Volume filter: Only trade breakouts with above-average volume.
- Close filter: Wait for the price to close beyond the level, not just wick through it. Intraday penetrations that close back inside the range are often traps.
- Percentage filter: Require a 1-2% move beyond the level before considering it a valid breakout.
- Time filter: Wait for the price to hold beyond the level for a full candle (e.g., one full day on a daily chart).
- Retest filter: Wait for the price to pull back to the broken level and bounce (role reversal) before entering.
Pro Tip
Entry Strategies for Breakout Trades
Entry on the Breakout Candle
The most aggressive entry is to buy as the price breaks through the level, either intraday or on the close. This approach gets you in at the earliest point but carries the highest risk of a false breakout.
To use this entry:
- Confirm volume is surging in real time
- Set a stop loss just inside the broken level
- Accept that some of these trades will be false breakouts
Entry on the Retest
The retest entry waits for the price to pull back to the broken level after the initial breakout. This is the most popular entry strategy among experienced traders because it provides:
- Confirmation that the level has undergone role reversal
- A tighter stop loss placement
- A better risk-to-reward ratio
The risk is that not all breakouts retest. Some strong breakouts move immediately without looking back, and you miss the trade entirely.
Entry on the First Pullback
If the retest does not reach the broken level, you can enter on the first pullback to any short-term support within the new range. This might be a minor intraday support level or a moving average.
Stop Loss Placement
Stop loss placement on breakout trades is straightforward. Your stop should be at a point that, if reached, would invalidate the breakout thesis.
Common stop loss approaches:
| Method | Placement | Best For |
|---|---|---|
| Below the broken level | Just below the support-turned-resistance (or above the resistance-turned-support for shorts) | Retest entries |
| Below the breakout candle low | Below the low of the candle that broke out | Breakout candle entries |
| ATR-based | 1.5 to 2 times the Average True Range below the entry | Volatile stocks |
| Pattern-based | Below the low of the consolidation pattern | Pattern breakouts |
Whichever method you choose, make sure the stop loss is placed at a logical level based on price structure, not an arbitrary dollar amount or percentage.
Setting Profit Targets
There are several methods for projecting where a breakout might travel:
Measured Move
The measured move technique projects the height of the consolidation pattern from the breakout point. If a stock consolidated in a $5 range and breaks above resistance at $50, the projected target is $55.
Target = Breakout Level + (High of Range - Low of Range)Key Resistance Levels
Identify the next significant resistance level above the breakout point. This is where the price is likely to encounter selling and where you might consider taking partial or full profits.
Trailing Stop
A trailing stop allows you to stay in a trade as long as it continues in your favor. After the breakout, trail your stop below each successive swing low, locking in profits while giving the trade room to breathe. Learn more about trailing stops.
Breakout Trading Across Timeframes
Breakouts occur on every timeframe, from 1-minute charts to monthly charts. The principles are the same, but the implications differ.
- Intraday breakouts (1-minute to 15-minute): Quick moves, small targets, high noise
- Daily breakouts: The sweet spot for swing traders, with multi-day follow-through
- Weekly breakouts: Significant moves that can last weeks to months
- Monthly breakouts: Major trend changes that can define years of price action
For best results, confirm that the breakout on your trading timeframe aligns with the trend on a higher timeframe. A daily chart breakout that occurs within a weekly uptrend has a much higher probability of success than one that goes against the weekly trend. See our guide on multiple time frame analysis.
Frequently Asked Questions
What percentage of breakouts fail?
Studies suggest that roughly 30-50% of breakouts fail and reverse back into the range, depending on the market environment and the criteria used. This is why volume confirmation, proper filters, and disciplined stop losses are essential. Even with a 50% failure rate, breakout trading can be profitable if winners are significantly larger than losers.
Should I chase a breakout I missed?
No. Chasing breakouts after they have moved significantly beyond the level is one of the most common trading mistakes. If you missed the initial breakout, wait for a pullback to the broken level or move on to the next opportunity. There will always be another breakout.
How long should I wait for a breakout from a consolidation?
There is no specific time limit, but the longer a stock consolidates near a level, the more significant the eventual breakout tends to be. If a stock has been building a base for weeks or months, it is worth keeping on your watchlist. Set alerts at key levels rather than watching the screen constantly.
Can I use breakout trading for short selling?
Absolutely. Breakdown trading (breakouts to the downside) applies the same principles in reverse. Look for support levels that have been tested multiple times, wait for a decisive close below on heavy volume, and enter short positions. The same filters for false breakouts apply.
What is the best timeframe for breakout trading?
The daily timeframe offers the best balance between signal quality and trade frequency for most traders. Daily breakouts have enough momentum to produce meaningful moves while filtering out much of the noise found on intraday charts. Swing traders and position traders typically find the most success with daily and weekly chart breakouts.
Disclaimer
This is educational content, not financial advice. Trading involves risk, and you should consult a qualified financial advisor before making any investment decisions. Past performance does not guarantee future results.
Related Articles
12 chapters covering charts, indicators, risk management & more. Plus weekly trading insights.