What Is Volume in Stocks? Why It's the Most Underrated Indicator
⚡ Key Takeaways
- Volume represents the total number of shares traded in a given period and confirms the strength of price moves
- Rising prices on high volume confirm bullish strength; rising prices on low volume warn of weakness
- Volume spikes often precede major turning points — climactic volume signals exhaustion
- Key volume indicators include OBV, VWAP, volume profile, and the accumulation/distribution line
What Is Volume in Stock Trading?
Volume is the total number of shares or contracts traded for a given security during a specific time period. It is one of the most fundamental yet often underutilized indicators in technical analysis. While price tells you what happened, volume tells you how much conviction was behind it.
Every transaction requires both a buyer and a seller. High volume means strong participation — many traders agree that a price move is warranted. Low volume means limited participation, raising questions about the sustainability of the move.
Volume is displayed as a histogram (vertical bars) at the bottom of most stock charts. Each bar represents the total shares traded during that candle period — one day on a daily chart, one minute on a minute chart, and so on.
Why Volume Matters
Volume provides three critical pieces of information:
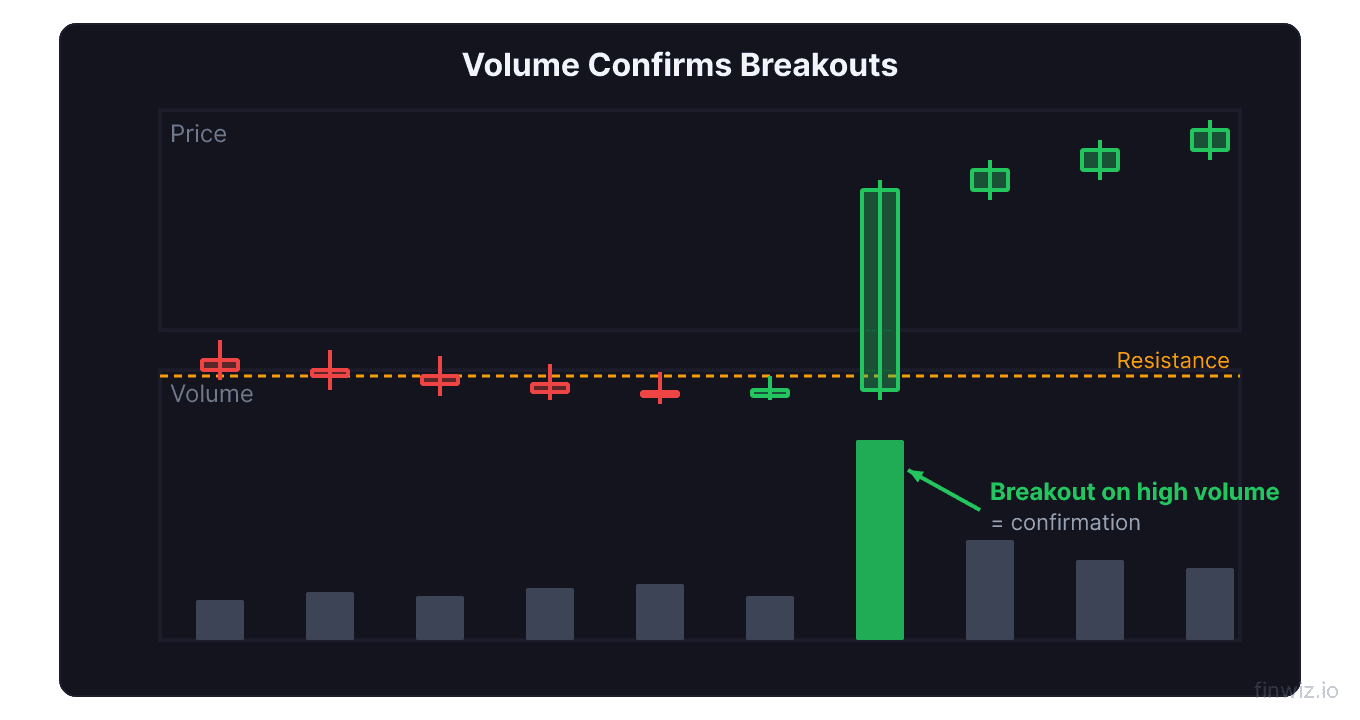
Confirmation. Price moves accompanied by above-average volume are more likely to be sustained. A breakout from a chart pattern on high volume is far more reliable than one on low volume.
Conviction. Volume measures the intensity of buying or selling pressure. When a stock rallies on 3x normal volume, institutions are likely accumulating shares — a much stronger signal than a rally on below-average volume.
Exhaustion. Extremely high volume can signal the climax of a move — a blow-off top during a rally or a selling climax during a decline. These Wyckoff-style climactic volume events often mark turning points.
Volume and Price Relationships
The relationship between volume and price movement reveals critical information about market health:
| Price Action | Volume | Interpretation |
|---|---|---|
| Price up, volume up | Strong | Healthy uptrend confirmed |
| Price up, volume down | Weak | Uptrend losing momentum, caution |
| Price down, volume up | Strong | Active selling pressure, bearish |
| Price down, volume down | Weak | Selling pressure waning, potential bottom |
| Price flat, volume spike | Significant | Accumulation or distribution underway |
Pro Tip
Average Volume: Establishing a Baseline
Average volume provides context for evaluating whether current volume is noteworthy. The most common measurement is the 50-day average volume, which smooths out day-to-day fluctuations.
Relative Volume (RVOL) = Current Volume ÷ Average VolumeRelative volume (RVOL) normalizes current volume against the average, making it easy to spot unusual activity. A stock trading at 3x its average volume is experiencing significant interest, regardless of whether it normally trades 100,000 or 10 million shares per day.
Many trading platforms and screeners allow you to filter stocks by relative volume, helping you find the most active and potentially tradable situations each day.
Volume Spikes and What They Mean
A volume spike occurs when volume dramatically exceeds the recent average — typically 2x or more. Spikes draw attention because they indicate that something significant is happening:
Earnings announcements. Volume routinely surges 3-10x average on earnings days as investors react to results. The direction and magnitude of the price move on this elevated volume sets the tone for subsequent trading.
News events. Analyst upgrades/downgrades, FDA approvals, contract announcements, and management changes all trigger volume spikes. The persistence of the volume increase matters — a one-day spike is less significant than multiple days of elevated volume.
Breakouts and breakdowns. Valid breakouts from chart patterns occur on high volume. A cup-and-handle breakout on 5x average volume is a strong buy signal. A breakout on below-average volume is suspicious.
Capitulation. In a declining stock, a massive volume spike accompanied by a large red candle often marks a selling climax. After everyone who wants to sell has sold, the selling pressure is exhausted and the stock can begin to recover. This concept is central to Wyckoff analysis.
Key Volume Indicators
On-Balance Volume (OBV)
OBV is a cumulative volume indicator that adds volume on up days and subtracts volume on down days. It tracks whether volume is flowing into or out of a security.
If today's close > yesterday's close:Rising OBV confirms an uptrend — buying pressure exceeds selling pressure. Falling OBV confirms a downtrend. When OBV diverges from price (e.g., price makes a new high but OBV does not), it signals a potential reversal.
Volume-Weighted Average Price (VWAP)
VWAP calculates the average price of a security weighted by volume throughout the trading day. Institutional traders use VWAP as a benchmark — they want to buy below VWAP and sell above it.
For day traders, VWAP serves as a dynamic support/resistance level. A stock trading above VWAP is showing bullish intraday strength; below VWAP indicates bearish intraday weakness.
Accumulation/Distribution Line
The A/D line considers where price closes within the day's range, not just whether it closed up or down. A close near the high with high volume indicates strong accumulation; a close near the low with high volume indicates distribution.
This indicator is particularly useful for detecting institutional accumulation or distribution that may not be immediately obvious from price action alone.
Volume Profile
Volume profile displays volume horizontally at each price level rather than vertically over time. It reveals which price levels have the highest trading activity — these high-volume nodes act as magnets for price and often serve as strong support or resistance.
Low-volume areas between high-volume nodes are "gaps" that price tends to move through quickly. Volume profile is heavily used in futures trading and is gaining popularity in equity analysis.
Volume in Different Market Conditions
Volume behaves differently across market environments:
Bull markets. Volume tends to be higher on up days than down days. The advance-decline volume (total volume of advancing stocks vs. declining stocks) confirms the broader trend.
Bear markets. Volume spikes on down days as selling intensifies. Volume on rallies tends to be light, indicating they are short-covering rallies rather than genuine buying.
Consolidation/ranges. Volume typically contracts as the stock moves sideways. This decreasing volume creates a "coil" of energy that releases when the range breaks. A symmetrical triangle with contracting volume is a textbook setup.
Corrections. During healthy corrections within a bull market, volume should decrease on the pullback, indicating that selling pressure is mild. If volume increases during the pullback, the correction may be more serious.
Volume Analysis for Day Traders
Day traders rely heavily on volume analysis:
Opening volume. The first 30-60 minutes of trading typically produce the highest volume of the day. This is when overnight news, pre-market gaps, and institutional orders are processed. Many day traders focus their activity on this window.
Midday lull. Volume typically drops significantly between 11:30 AM and 2:00 PM EST. Price moves during this period are less reliable because of reduced participation.
Closing volume. Volume increases in the final hour (3-4 PM EST) as institutional traders execute end-of-day orders. The closing print on high volume can set the stage for the next day's direction.
Volume at key levels. When price approaches a key support or resistance level, watch volume closely. A surge of volume as price approaches resistance suggests buyers are fighting to break through. A drop in volume suggests the breakout will likely fail.
Common Volume Analysis Mistakes
Ignoring volume entirely. Price-only analysis misses critical confirmation signals. Always check volume when evaluating breakouts, reversals, and trend health.
Comparing volume across stocks. A stock trading 500,000 shares on a normal day is not comparable to one trading 50 million. Always use relative volume to normalize comparisons.
Overreacting to single spikes. One day of high volume does not establish a trend. Look for patterns of sustained volume changes over multiple days.
Ignoring pre/post-market volume. Extended hours volume can provide early signals about the next session's direction. However, pre/post-market volume is much thinner and prices can be misleading.
FAQ
What is considered high volume for a stock?
There is no universal threshold. What matters is volume relative to that stock's average. A stock normally trading 200,000 shares that trades 1 million shares is experiencing significant activity (5x RVOL), even though 1 million shares would be quiet for a stock like Apple (which averages 50+ million).
Does volume predict price direction?
Volume alone does not predict direction — it confirms the strength of a price move. Rising volume on an advance confirms bullish strength. Rising volume on a decline confirms bearish pressure. Volume tells you how significant a move is, not where price is going next.
Why does volume decline during consolidation?
Declining volume during consolidation indicates that both buyers and sellers are stepping back, waiting for a catalyst. This contraction in activity creates potential energy that is released when the range breaks. The direction of the breakout — confirmed by volume expansion — determines the next move.
What is the best volume indicator?
There is no single best indicator. OBV is excellent for trend confirmation and divergence detection. VWAP is essential for intraday traders. Volume profile is powerful for identifying key support/resistance levels. Most analysts use multiple volume tools together.
How does volume relate to Wyckoff analysis?
Wyckoff methodology places volume at the center of analysis. Wyckoff identified specific volume patterns during accumulation and distribution phases. Climactic volume (springs and upthrusts), volume dry-ups during tests, and volume expansion during breakouts are all key Wyckoff concepts.
Disclaimer
This is educational content, not financial advice. Trading involves risk, and you should consult a qualified financial advisor before making any investment decisions. Past performance does not guarantee future results.
Related Articles
12 chapters covering charts, indicators, risk management & more. Plus weekly trading insights.