Consolidation: What It Means & How to Trade the Breakout
⚡ Key Takeaways
- Consolidation is a period of sideways price action where a stock trades within a defined range after a directional move
- Consolidation occurs because the market needs to absorb the previous move — profit-taking meets new demand, creating equilibrium
- Breakout trades from consolidation patterns offer high reward-to-risk setups when confirmed by volume expansion
- Tightening price ranges and declining volume during consolidation signal that a breakout is approaching
- The direction of the breakout tends to follow the direction of the prior trend (continuation) more often than it reverses
What Is Consolidation?
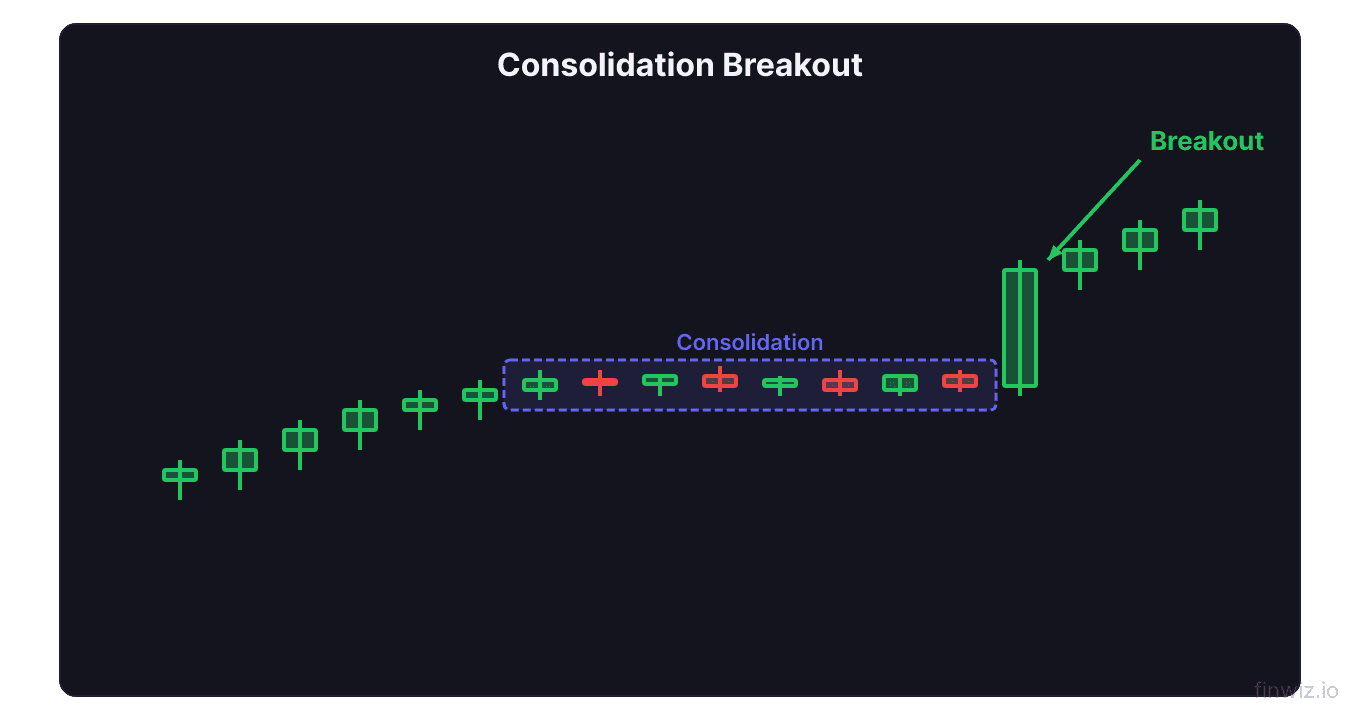
Consolidation is a period when a stock's price moves sideways within a relatively narrow range, forming a pause in the prior trend. It appears as a cluster of candles contained between a defined ceiling (resistance) and floor (support).
Consolidation is not random noise. It is the market processing information. After a strong move in either direction, participants need time to reassess. Traders who bought lower take profits, new buyers step in at what they perceive as fair value, and the two forces reach a temporary balance. This tug-of-war creates the sideways range visible on the chart.
The critical insight is that consolidation resolves. Price cannot stay in a range forever. Eventually, one side wins — either buyers push through resistance or sellers break through support — and the stock begins a new directional move. Trading that breakout is one of the most reliable strategies in technical analysis.
What Consolidation Looks Like on a Chart
Consolidation takes several recognizable forms, each with slightly different characteristics but the same underlying principle:
Rectangles — Price bounces between horizontal support and resistance levels. The range is clearly defined, and both boundaries are tested multiple times. This is the most common consolidation pattern.
Triangles — Price compresses into a tightening range. Ascending triangles have a flat top and rising lows. Descending triangles have a flat bottom and declining highs. Symmetrical triangles have converging trend lines from both sides.
Flags and pennants — These are compact consolidation patterns that form on a slight angle against the prior trend. They typically resolve quickly (1 to 3 weeks) and are considered continuation patterns.
Regardless of the shape, the key features are the same: price is contained, the range narrows over time, and volume declines as the pattern develops. This compression of price and volume creates the coiled-spring effect that produces powerful breakouts.
Why Consolidation Happens
Consolidation serves three functions in the market:
Profit absorption — After a strong rally, early buyers sell to lock in gains. New buyers absorb this selling, but not aggressively enough to push prices higher. The result is a sideways range where supply and demand find temporary balance.
Base building — During consolidation, the stock builds a base of holders at the current price level. These holders are committed at this price and will not sell easily. This creates a foundation of support that fuels the next leg higher.
Uncertainty resolution — Sometimes the market consolidates while waiting for new information: an earnings report, a Fed decision, or sector-specific news. Once the catalyst arrives, the consolidation resolves.
NVDA demonstrated a textbook consolidation in mid-2024 before its breakout above the $500 level. The stock spent several weeks trading between $460 and $500 after a massive run from $300. Volume steadily declined during this range. When the breakout finally came on heavy volume, the stock surged past $500 and continued to $700 over the following months.
How to Trade the Breakout
Breakout trading from consolidation is a structured process with clear rules for entry, stop placement, and targets.
Entry criteria:
- The consolidation range must be clearly defined with at least two touches of both support and resistance
- Volume should be declining within the range, showing compression
- The breakout candle must close beyond the boundary (not just wick through it)
- Volume on the breakout candle should be at least 50% above the average volume during the consolidation
Stop placement:
Place your stop on the opposite side of the consolidation range. If you buy a breakout above resistance, your stop goes below the range's support level. This gives the trade room to breathe while protecting you if the breakout fails.
Target projection:
Breakout Target = Breakout Level + Height of Consolidation RangeIf a stock consolidates between $100 and $110 and breaks out above $110, the measured target is $120. This is a minimum target — strong breakouts often exceed the measured move.
Pro Tip
Volume: The Breakout Confirmation Tool
Volume is the difference between a genuine breakout and a false breakout. Volume analysis during and after the breakout provides critical confirmation.
During consolidation — Volume should progressively decline. This contraction shows that participation is decreasing, which creates the conditions for a volatile move when new orders enter the market. Bollinger Bands visually capture this compression as the bands squeeze together during low-volatility consolidation.
On the breakout — Volume must expand significantly. A breakout on average or below-average volume is suspect and more likely to fail. Look for at least 1.5 to 2 times the average volume within the consolidation range.
After the breakout — Healthy breakouts show continued elevated volume for the first 2 to 3 sessions. If volume immediately dries up after the breakout candle, the move may lack follow-through and could reverse back into the range.
False breakouts are common and represent the primary risk of this strategy. Price pushes beyond the boundary, triggers breakout entries, then immediately reverses back into the range. The traders who bought the breakout are now trapped and become forced sellers, which accelerates the reversal.
The best defense against false breakouts is patience. Wait for a full candle close beyond the range with confirming volume rather than entering on the initial push.
Consolidation as a Continuation Signal
Consolidation patterns within an existing trend are more likely to resolve in the direction of the prior trend. An uptrend that pauses in a consolidation is more likely to break out to the upside than to the downside. This is because the underlying demand that created the uptrend has not disappeared — it is simply resting.
This principle has practical implications for trade selection. When you see consolidation in an uptrending stock, your default bias should be bullish. You should be looking for a long entry on an upside breakout rather than anticipating a breakdown.
The same applies in reverse. Consolidation within a downtrend is more likely to break down. The selling pressure that drove the decline is pausing, not disappearing.
When consolidation resolves against the prior trend — an uptrend consolidation that breaks down, or a downtrend consolidation that breaks up — it signals a meaningful trend change and often produces extended moves because it catches the majority of traders on the wrong side.
Pro Tip
FAQ
How long should consolidation last before the breakout is tradeable?
A minimum of 5 to 7 trading sessions gives the pattern enough structure to be meaningful. Consolidations lasting 2 to 6 weeks tend to produce the most reliable breakouts for swing traders. Very short consolidations (2 to 3 days) can work for day traders but produce smaller moves. Very long consolidations (3+ months) are often better described as accumulation or distribution phases.
What happens if I buy a breakout and the price falls back into the range?
This is a false breakout, and you should exit the trade at your stop-loss level. Do not hold and hope. The fact that the breakout failed is information — it tells you that the opposing side is stronger than the breakout suggested. Some traders will then look to trade in the opposite direction, entering short after a failed upside breakout.
Can I trade consolidation without waiting for the breakout?
Yes. Range trading involves buying near support and selling near resistance within the consolidation. This works well in wide, well-defined ranges but requires quick exits if a boundary breaks. The risk is being on the wrong side when the eventual breakout occurs. Many traders combine both approaches — range trading while the pattern develops, then switching to a breakout strategy once the range narrows and volume compression signals an imminent resolution.
12 chapters covering charts, indicators, risk management & more. Plus weekly trading insights.