Bollinger Bands: How to Trade Volatility Squeezes & Breakouts
⚡ Key Takeaways
- Bollinger Bands consist of a 20-period SMA (middle band) with upper and lower bands set at 2 standard deviations, dynamically adjusting to volatility
- The Bollinger Squeeze — when bands contract tightly — signals an impending high-volatility breakout in either direction
- Bollinger Band width and %B indicators provide quantifiable measures of volatility and price position within the bands
- W-bottom and M-top patterns within Bollinger Bands are reliable reversal signals identified by creator John Bollinger
- Prices touching the upper or lower band are NOT automatic sell or buy signals — context and confirmation matter
What Are Bollinger Bands?
Bollinger Bands are a volatility-based technical indicator created by John Bollinger in the 1980s. They consist of three lines plotted on a price chart: a middle band (a simple moving average), an upper band, and a lower band. The upper and lower bands expand and contract based on price volatility, making Bollinger Bands one of the most adaptive indicators available.
The genius of Bollinger Bands lies in their dynamic nature. Unlike fixed-percentage envelopes, Bollinger Bands automatically widen during volatile periods and narrow during calm periods. This self-adjusting mechanism means the bands always reflect current market conditions, providing relevant information regardless of whether the market is trending or consolidating.
Bollinger Bands are used across all markets and timeframes, from intraday scalping to monthly investing charts. They help traders identify overbought and oversold conditions, spot potential breakouts, and measure volatility. John Bollinger himself emphasizes that the bands should be used with other indicators for confirmation, not as a standalone trading system.
How Bollinger Bands Are Calculated
The construction of Bollinger Bands involves a simple moving average and standard deviation calculations.
Middle Band = 20-period Simple Moving Average (SMA)The standard deviation measures how much price has varied from the average over the lookback period. When prices are volatile, the standard deviation increases and the bands widen. When prices are calm, the standard deviation decreases and the bands contract.
With 2 standard deviations, approximately 95% of price action falls within the bands under normal distribution assumptions. This statistical foundation is what gives Bollinger Bands their analytical power — price movements outside the bands are statistically significant events.
| Parameter | Default Value | Effect of Increasing | Effect of Decreasing |
|---|---|---|---|
| Period | 20 | Smoother, wider bands | More responsive, tighter bands |
| Standard Deviations | 2 | Wider bands, fewer touches | Tighter bands, more touches |
The Bollinger Squeeze
The Bollinger Squeeze is one of the most popular and actionable Bollinger Band signals. It occurs when the bands contract to an unusually narrow width, indicating a period of low volatility.
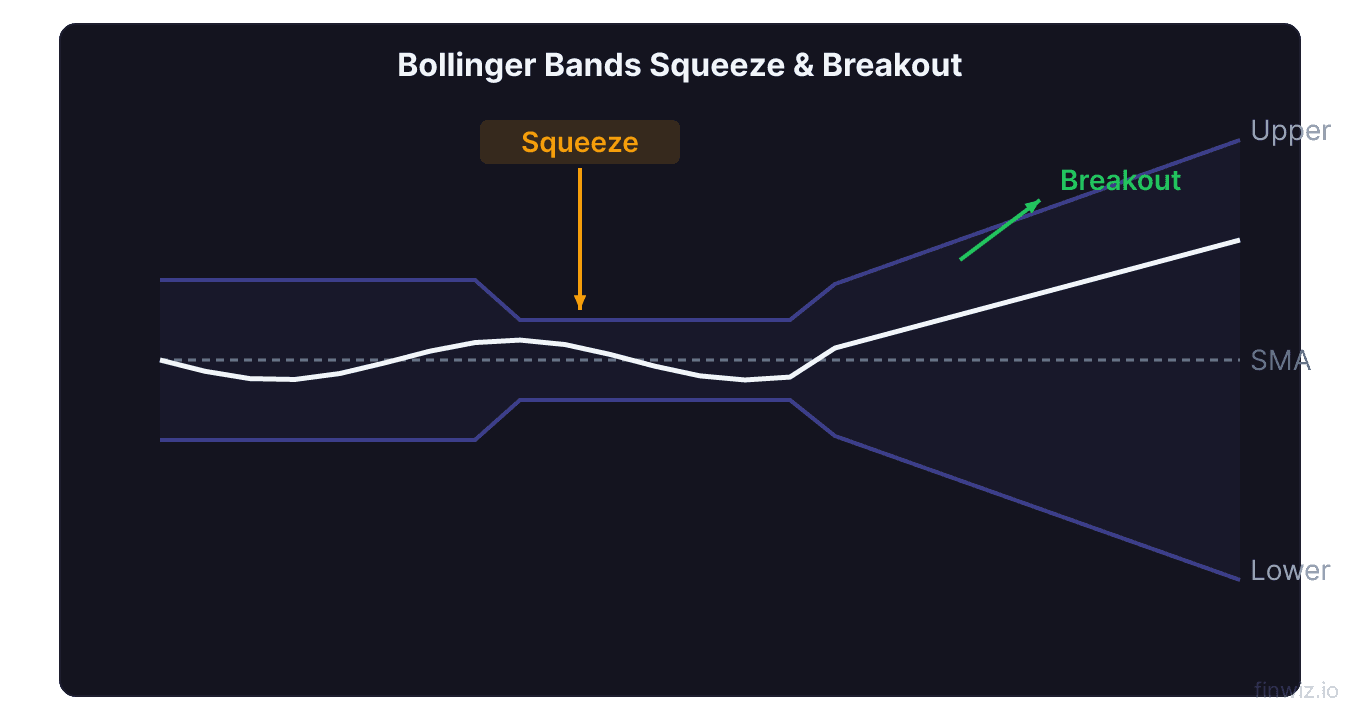
Why does the squeeze matter? Volatility is cyclical — periods of low volatility are inevitably followed by periods of high volatility, and vice versa. When the bands squeeze together, they are signaling that a significant price move is building. The squeeze does not predict the direction of the breakout, only that one is coming.
To identify a squeeze, look for the bands to narrow to a width that is small relative to the recent past. Many traders use the Bandwidth indicator (the difference between the upper and lower bands divided by the middle band) to quantify the squeeze. When Bandwidth reaches a multi-week or multi-month low, the squeeze is on.
Pro Tip
Trading Bollinger Band Breakouts
Once a squeeze is identified, the next step is determining the direction and timing of the breakout.
Breakout direction clues come from multiple sources. Check the overall trend using the middle band slope and moving averages. Look at volume patterns — is volume increasing on up moves or down moves during the squeeze? Use the MACD histogram to see if momentum is building in one direction. Examine support and resistance levels to understand where a breakout is more likely.
Entering a breakout trade requires patience and confirmation. Wait for a candle to close outside the upper or lower band with above-average volume. This closing confirmation reduces the chance of getting caught in a false breakout. Set your stop-loss on the opposite side of the middle band or just inside the band you broke out of.
Managing the trade involves trailing your stop along the middle band as the trend develops. In strong breakouts, the upper band serves as a guide for price — price can ride the upper band for extended periods in powerful uptrends. When price starts closing back inside the bands, it signals that the breakout momentum is fading.
W-Bottom and M-Top Patterns
John Bollinger identified specific price patterns within the bands that provide reliable reversal signals. The W-bottom and M-top are among the most important.
W-Bottom (Bullish Reversal)
A W-bottom forms when price drops to or below the lower band, bounces, pulls back again but holds above the lower band on the second dip, and then breaks above the reaction high. The key characteristic is that the first low typically touches or penetrates the lower band, while the second low holds inside the bands despite being at a similar price level. This shows that volatility is contracting and selling pressure is diminishing.
M-Top (Bearish Reversal)
An M-top is the inverse pattern. Price reaches the upper band, pulls back, rallies again but fails to touch the upper band on the second push, and then breaks below the reaction low. The failure to reach the upper band on the second rally is the critical signal — it indicates that buying momentum has weakened.
These patterns are remarkably similar to RSI divergence signals, and when both occur simultaneously, the reversal signal is particularly strong.
Bollinger Band Width and Percent B
Two derived indicators extend the analytical power of Bollinger Bands.
Bandwidth measures the width of the bands relative to the middle band. It is calculated as (Upper Band - Lower Band) / Middle Band. High Bandwidth values indicate high volatility. Low values indicate low volatility and potential squeeze conditions. Bandwidth is particularly useful for scanning multiple instruments to find those with the tightest squeezes.
Percent B tells you where the current price sits within the bands. It is calculated as (Price - Lower Band) / (Upper Band - Lower Band). A reading of 1.0 means price is at the upper band. A reading of 0.0 means price is at the lower band. A reading of 0.5 means price is at the middle band. Readings above 1.0 indicate price has broken above the upper band, while readings below 0.0 indicate a break below the lower band.
| Percent B Reading | Position | Interpretation |
|---|---|---|
| Above 1.0 | Above upper band | Extremely overbought or strong breakout |
| 0.80 - 1.0 | Upper band zone | Overbought territory |
| 0.50 | Middle band | Neutral |
| 0.0 - 0.20 | Lower band zone | Oversold territory |
| Below 0.0 | Below lower band | Extremely oversold or strong breakdown |
Pro Tip
Bollinger Bands Trading Strategies
Strategy 1: Band Bounce (Mean Reversion)
In range-bound markets, price tends to bounce between the upper and lower bands like a ball bouncing between walls. Buy near the lower band and sell near the upper band, using the middle band as a first target. Confirm bounces with stochastic oscillator readings in overbought or oversold territory. This strategy fails in trending markets, so always confirm the ranging condition first.
Strategy 2: Band Walk (Trend Following)
In strong trends, price walks along the upper or lower band, repeatedly touching or slightly exceeding it while the middle band provides support or resistance. During an upper band walk, buy pullbacks to the middle band with stops below it. This strategy captures the majority of a trend move. The trend is intact as long as pullbacks hold the middle band.
Strategy 3: Double Bottom at the Lower Band
When price touches the lower band, bounces to the middle band, then drops back near the lower band but holds above it (forming a W-bottom), enter long on the break above the middle band. This pattern combines the statistical extremity of the lower band with a double bottom price pattern for a high-probability reversal trade.
Strategy 4: Squeeze Breakout
When Bandwidth reaches a 6-month low, prepare for a breakout. Use MACD and OBV to gauge the likely direction. Enter on the first candle that closes outside the bands with volume confirmation. Trail your stop along the middle band.
Bollinger Bands Settings
While the default settings of 20 periods and 2 standard deviations work well for most applications, adjustments can optimize the bands for different purposes.
| Application | Period | Std Dev | Rationale |
|---|---|---|---|
| Day trading | 10-12 | 1.5-2 | More responsive for intraday moves |
| Swing trading | 20 | 2 | Standard — well-tested default |
| Position trading | 50 | 2.5 | Smoother, identifies major volatility shifts |
| Scalping | 5-9 | 1.5 | Ultra-responsive for quick trades |
John Bollinger recommends maintaining the relationship between period and standard deviations: shorter periods should use fewer standard deviations, and longer periods should use more. A 10-period setting might work best with 1.5 standard deviations, while a 50-period setting might require 2.5 standard deviations to maintain the statistical relevance of the bands.
Combining Bollinger Bands with Other Indicators
Bollinger Bands are most powerful when used in combination with other technical tools.
Bollinger Bands + RSI: When price touches the lower band and RSI is below 30, the oversold signal is confirmed by two independent methods. This confluence significantly increases the probability of a bounce. The reverse applies at the upper band with RSI above 70.
Bollinger Bands + Volume: Band touches are more significant when accompanied by volume extremes. A touch of the lower band on a volume climax (spike) often marks a capitulation selling event and potential bottom. Monitor OBV trends within the bands for additional confirmation.
Bollinger Bands + Keltner Channels: The squeeze play using both Keltner Channels and Bollinger Bands is a favorite among professional traders. Keltner Channels, based on ATR, provide a volatility baseline. When Bollinger Bands squeeze inside Keltner Channels, the setup has exceptional predictive power for breakouts.
Bollinger Bands + Candlestick Patterns: Reversal candlestick patterns at the bands carry extra weight. A hammer at the lower band or a shooting star at the upper band combines price action with statistical extremity.
Common Bollinger Band Mistakes
Selling when price touches the upper band. This is the most common misconception. In strong uptrends, price can ride the upper band for weeks. A touch of the upper band in an uptrend is a sign of strength, not a sell signal. Only fade band touches in confirmed ranging markets.
Ignoring the middle band. Many traders focus exclusively on the upper and lower bands and forget about the 20-period SMA in the middle. The middle band often acts as the most important dynamic support or resistance level. It determines whether a pullback is a buying opportunity or the start of a trend reversal.
Using Bollinger Bands in isolation. Bollinger Bands measure volatility and price position but do not indicate momentum or volume. Always confirm band signals with at least one momentum indicator and volume analysis.
Failing to adapt to the trend. Bollinger Band strategies must match the market condition. Mean-reversion strategies work in ranges. Trend-following strategies work in trends. Using the wrong approach for the current market condition is the primary cause of Bollinger Band trading failures.
Frequently Asked Questions
Are Bollinger Bands leading or lagging?
Bollinger Bands have both leading and lagging characteristics. The bands themselves are constructed from a moving average (lagging), but the squeeze signal is leading because it identifies low volatility before the breakout occurs. The bands adapt to current conditions in real time, making them more responsive than pure trend-following indicators. The best way to think about them is as a conditional indicator — they define the current volatility environment and price extremes, which you then interpret with additional tools.
What is the best Bollinger Band setting?
The default setting of 20 periods and 2 standard deviations is the best starting point and works well for most applications. John Bollinger tested these settings extensively and found they provide the right balance of sensitivity and reliability. For shorter timeframes like 5-minute charts, consider using 10-12 periods with 1.5 standard deviations. For longer timeframes like weekly charts, 20 periods with 2.5 standard deviations may be more appropriate. The key is maintaining the statistical relationship between period length and deviation width.
How do Bollinger Bands compare to Keltner Channels?
Both indicators create volatility-based envelopes around a moving average, but they use different volatility measures. Bollinger Bands use standard deviation, which causes them to expand and contract more dramatically. Keltner Channels use ATR (Average True Range), which produces smoother, more consistent bands. The practical difference is that Bollinger Bands are better for identifying squeeze breakouts, while Keltner Channels provide more stable support and resistance levels. Many traders use both together for the squeeze play strategy.
Can Bollinger Bands predict price direction?
Bollinger Bands cannot predict direction by themselves. They identify volatility conditions and statistical price extremes. The squeeze tells you a big move is coming but not which way. Band touches tell you price is at an extreme but not whether it will reverse or continue. To determine direction, you need additional tools like momentum indicators, volume analysis, trend lines, and chart patterns. Think of Bollinger Bands as defining the playing field while other indicators determine the strategy.
How do you scan for Bollinger Band squeezes?
Most charting platforms allow you to scan for low Bandwidth values, which quantify the squeeze. Set up a scan that identifies instruments where Bandwidth is at a 6-month or 12-month low. Some platforms have pre-built Bollinger Band squeeze screeners. You can also scan for Percent B values near 0.5 combined with low Bandwidth, which indicates price is centered within very tight bands — the ideal pre-breakout condition. Once you identify squeeze candidates, evaluate each chart manually to determine the likely breakout direction.
Disclaimer
This is educational content, not financial advice. Trading involves risk, and you should consult a qualified financial advisor before making any investment decisions. Past performance does not guarantee future results.
Related Articles
12 chapters covering charts, indicators, risk management & more. Plus weekly trading insights.