Keltner Channels: Volatility Bands vs Bollinger Bands
⚡ Key Takeaways
- Keltner Channels are volatility-based envelopes using ATR (Average True Range) around an EMA, providing smoother bands than Bollinger Bands
- The standard settings use a 20-period EMA with upper and lower bands at 2 ATR distance, adapting to market volatility
- The Keltner-Bollinger squeeze — when Bollinger Bands move inside Keltner Channels — is one of the most reliable breakout signals in technical analysis
- Keltner Channel breakouts signal strong momentum when price closes outside the channels with volume confirmation
- Keltner Channels provide more stable support and resistance than Bollinger Bands due to ATR
What Are Keltner Channels?
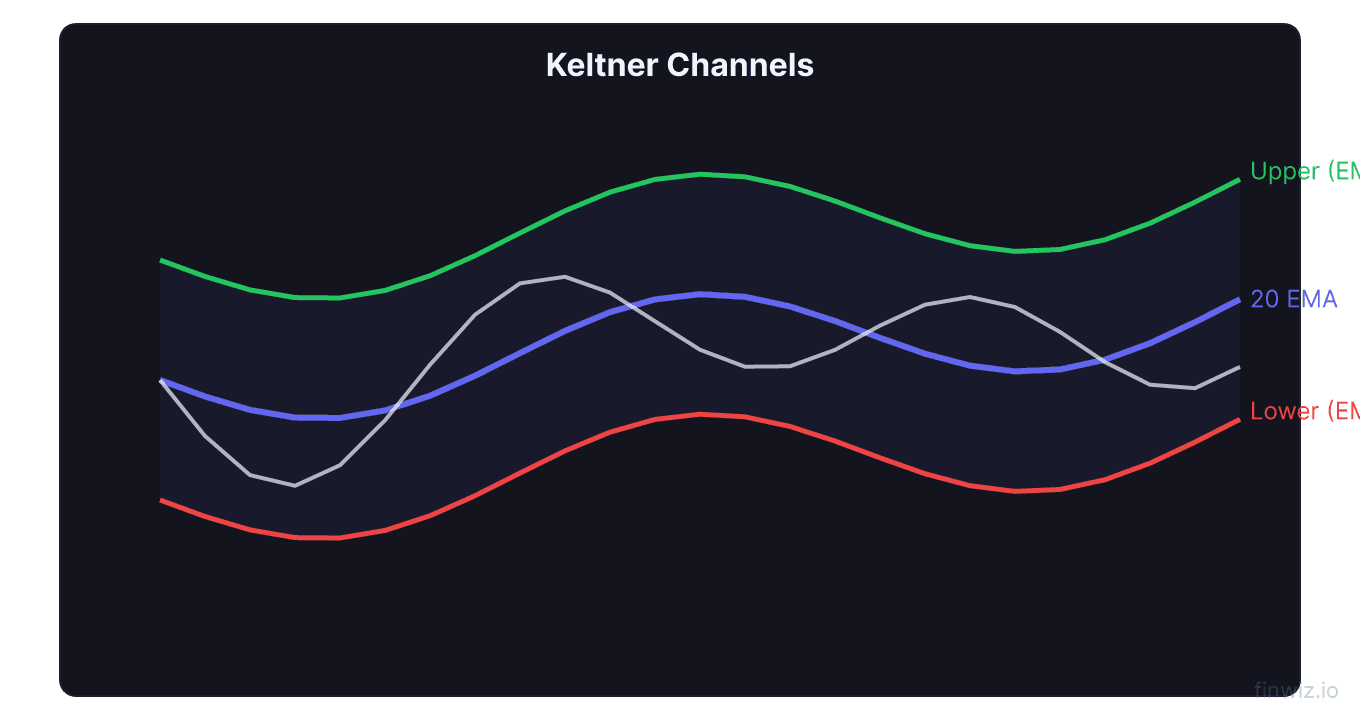
Keltner Channels are a volatility-based envelope indicator consisting of three lines: a middle line (exponential moving average), an upper channel, and a lower channel. The channels are calculated by adding and subtracting a multiple of the Average True Range (ATR) from the middle EMA line.
Originally developed by Chester Keltner in 1960 and later refined by Linda Bradford Raschke, Keltner Channels serve a similar purpose to Bollinger Bands but use a fundamentally different volatility measurement. While Bollinger Bands use standard deviation, Keltner Channels use ATR, which produces smoother, more consistent band movements.
This smoothness is both an advantage and a disadvantage. Keltner Channels provide more stable support and resistance levels that do not expand and contract as dramatically as Bollinger Bands. However, they are less sensitive to sudden volatility spikes, which means they may miss some squeeze and breakout signals that Bollinger Bands would catch. The solution, as many professional traders have discovered, is to use both indicators together.
How Keltner Channels Are Calculated
The Keltner Channel calculation is straightforward and relies on two well-established components — the EMA and ATR.
Middle Line = 20-period Exponential Moving Average (EMA)The EMA provides the trend direction and centerline, while the ATR determines the channel width based on actual price volatility. When ATR increases (volatility rises), the channels widen. When ATR decreases (volatility contracts), the channels narrow.
| Parameter | Default Value | Effect of Increasing | Effect of Decreasing |
|---|---|---|---|
| EMA Period | 20 | Smoother centerline, wider channels | More responsive centerline |
| ATR Period | 10 | Smoother channel width changes | More reactive to volatility shifts |
| ATR Multiplier | 2.0 | Wider channels, fewer breakouts | Narrower channels, more breakouts |
The choice of a 10-period ATR (rather than 14, the default for standalone ATR) was Linda Raschke's modification. The shorter ATR period makes the channels slightly more responsive to recent volatility changes while still maintaining the smoother character that distinguishes Keltner Channels from Bollinger Bands.
Keltner Channels vs. Bollinger Bands
Understanding the differences between Keltner Channels and Bollinger Bands is essential because many strategies use both together.
| Feature | Keltner Channels | Bollinger Bands |
|---|---|---|
| Volatility measure | ATR (Average True Range) | Standard Deviation |
| Middle line | EMA (Exponential Moving Average) | SMA (Simple Moving Average) |
| Band behavior | Smooth, consistent expansion/contraction | Dramatic expansion/contraction |
| Best for | Stable support/resistance, trend channels | Squeeze identification, statistical extremes |
| Sensitivity to outliers | Lower — ATR is more stable | Higher — outliers inflate standard deviation |
| Squeeze signal | Provides the reference bands for squeeze | Moves inside Keltner for squeeze confirmation |
The key practical difference is that Bollinger Bands expand and contract more aggressively because standard deviation is more sensitive to outlier price movements. A single large candle can significantly widen Bollinger Bands, while Keltner Channels respond more gradually because ATR smooths out individual bar effects.
This difference is precisely why the two indicators work so well together. Keltner Channels provide a stable volatility reference, and Bollinger Bands show when current volatility (standard deviation) has contracted below the ATR-based norm — the squeeze signal.
Pro Tip
The Keltner-Bollinger Squeeze
The Keltner-Bollinger Squeeze is one of the most powerful trading setups in technical analysis. Popularized by John Carter in his book Mastering the Trade, it uses the relationship between Keltner Channels and Bollinger Bands to identify high-probability breakout opportunities.
Squeeze On: When the Bollinger Bands (both upper and lower) move inside the Keltner Channels, the squeeze is "on." This means that price volatility (as measured by standard deviation) has contracted below the normal ATR-based range. The market is coiling like a spring.
Squeeze Off: When the Bollinger Bands expand back outside the Keltner Channels, the squeeze has "fired." The compressed energy is now being released, and a significant directional move is underway. The first bar where the bands expand outside Keltner is the entry signal.
Direction determination: The squeeze tells you a move is coming but not the direction. Use momentum indicators to determine which way. Carter recommends checking the MACD histogram or a momentum oscillator. If momentum is positive when the squeeze fires, go long. If momentum is negative, go short.
The reliability of the Keltner-Bollinger Squeeze comes from the complementary nature of the two volatility measurements. Standard deviation and ATR measure volatility differently, and when both agree that volatility is compressed, the subsequent expansion is almost certain.
Keltner Channel Breakout Trading
Beyond the squeeze strategy, Keltner Channels produce valuable breakout signals on their own.
Upper channel breakout: When price closes above the upper Keltner Channel, it signals strong bullish momentum. The close above the channel indicates that price has exceeded the normal ATR-based range, suggesting that buying pressure is unusually strong. Enter long on the close above the upper channel with a stop at the middle EMA line.
Lower channel breakout: When price closes below the lower Keltner Channel, bearish momentum is dominant. Enter short on the close below the lower channel with a stop at the middle EMA.
Breakout confirmation is essential. Look for increasing volume on the breakout candle, MACD momentum aligning with the breakout direction, and ideally a breakout from a recognizable price pattern (triangle, flag, or range). A Keltner Channel breakout without volume is suspect and should be treated cautiously.
Channel walks occur when price breaks above (or below) the Keltner Channel and continues to ride along the outer band. This "walking the channel" behavior indicates a powerful trend. During a channel walk, the middle EMA serves as a trailing stop reference — the trend remains intact as long as pullbacks hold the EMA.
Keltner Channel Trading Strategies
Strategy 1: Keltner-Bollinger Squeeze Play
Identify when Bollinger Bands are inside Keltner Channels (squeeze on). Wait for the Bollinger Bands to expand outside Keltner (squeeze fires). Enter in the direction indicated by momentum (MACD histogram, RSI, or simple price momentum). Set your stop on the opposite side of the middle EMA. Target 2-3 ATR from entry or the next significant support/resistance level.
Strategy 2: Channel Bounce Mean Reversion
In range-bound markets (when ADX is below 25), trade bounces between the upper and lower Keltner Channels. Buy near the lower channel and sell near the upper channel, using the middle EMA as your first target. Confirm bounces with stochastic oscillator readings in overbought or oversold territory. This strategy exploits the natural mean-reverting tendency within channels.
Strategy 3: EMA Pullback within Channel Trend
In a trending market, use the middle EMA of the Keltner Channel as a pullback entry level. When price is trending above the upper channel and pulls back to the middle EMA, look for buying opportunities. The EMA acts as dynamic support within the uptrend channel. Place your stop below the lower channel. This is similar to moving average bounce strategies but with the added context of the volatility bands.
Strategy 4: Double Breakout Confirmation
Wait for price to close outside the Keltner Channel and simultaneously outside the Bollinger Bands. When both envelope indicators are breached on the same candle with volume, the breakout signal is exceptionally strong. These double breakouts are rare but highly reliable, capturing the beginning of significant trending moves.
Pro Tip
Keltner Channel Settings
The most common Keltner Channel settings use a 20-period EMA with 2.0 ATR multiplier, but adjustments can be made for different purposes.
| Trading Style | EMA Period | ATR Period | ATR Multiplier | Use Case |
|---|---|---|---|---|
| Day trading | 10-15 | 10 | 1.5 | More responsive for intraday |
| Standard | 20 | 10 | 2.0 | Swing trading, general analysis |
| Conservative | 20 | 10 | 2.5 | Fewer breakout signals, wider channels |
| For squeeze | 20 | 10 | 1.5 | Tighter channels for more frequent squeezes |
For the Keltner-Bollinger Squeeze, the Keltner settings matter because they define the reference bands. A 1.5 ATR multiplier creates tighter channels, making squeezes more common but potentially less significant. A 2.0 multiplier creates the standard reference — squeezes are less frequent but more meaningful. John Carter uses 1.5 ATR multiplier for Keltner in his squeeze setup.
The ATR period affects how responsive the channel width is. A 10-period ATR (the default) responds reasonably quickly to volatility changes. A shorter period (7) makes channels more reactive, while a longer period (14) provides smoother channels.
Keltner Channels on Different Markets
Stocks: Keltner Channels work well on individual stocks, particularly those with clear trending and ranging cycles. The daily chart with standard settings is the most common application. Large-cap stocks produce the most reliable channel signals.
Forex: The 4-hour and daily charts are ideal timeframes for Keltner Channel analysis in forex. Currency pairs tend to respect channel boundaries well, and the squeeze strategy is particularly effective in forex due to the market's tendency to consolidate before major moves.
Futures: Index futures (ES, NQ) and commodity futures respond well to Keltner Channel analysis. The Keltner-Bollinger Squeeze is widely used by futures traders for capturing directional moves.
Cryptocurrency: Crypto markets benefit from Keltner Channels, though the higher volatility may require a wider ATR multiplier (2.5 instead of 2.0) to prevent excessive false breakout signals on daily charts.
Common Keltner Channel Mistakes
Confusing Keltner Channels with Bollinger Bands. While they look similar, they are built on different volatility measurements and serve complementary purposes. Using them interchangeably misses the unique strengths of each. Use both together, not one or the other.
Trading channel touches as reversals in trends. In strong trends, price can ride along the upper or lower Keltner Channel for extended periods. Fading a channel touch in a strong trend leads to losses. Only trade mean-reversion bounces when the market is confirmed as range-bound.
Using squeeze signals without momentum context. The squeeze identifies that a breakout is coming but not the direction. Trading the squeeze without checking momentum indicators leads to directional guessing. Always use MACD, RSI, or price momentum to determine the breakout direction.
Ignoring the middle EMA. The centerline EMA is a key support/resistance level and trend filter. In uptrends, it supports pullbacks. In downtrends, it caps rallies. Many traders focus only on the outer channels and miss the most active level on the chart.
Frequently Asked Questions
Are Keltner Channels better than Bollinger Bands?
Neither is inherently better — they measure volatility differently and excel in different situations. Keltner Channels provide smoother, more stable bands that are better for identifying clean trend channels and consistent support/resistance. Bollinger Bands are better for identifying statistical price extremes and squeeze/breakout conditions. The best approach is to use both together, leveraging Keltner's stability as a reference for Bollinger's more volatile behavior. The squeeze strategy requires both indicators working in tandem.
What is the best Keltner Channel setting for the squeeze?
For the Keltner-Bollinger Squeeze strategy, John Carter recommends a 20-period EMA with a 1.5 ATR multiplier for the Keltner Channels, paired with standard 20-period, 2-standard-deviation Bollinger Bands. The 1.5 ATR multiplier creates tighter Keltner Channels, which means squeezes occur when Bollinger Bands contract to an even tighter width — indicating a more significant compression. Some traders use 2.0 ATR for fewer but potentially stronger squeeze signals.
How do you determine breakout direction from a squeeze?
The squeeze itself only indicates that a significant move is imminent, not its direction. To determine direction, check the MACD histogram slope — if it is rising (becoming less negative or more positive), the breakout is likely bullish. If falling (becoming less positive or more negative), the breakout is likely bearish. You can also check the slope of the Keltner Channel middle EMA, the position of price relative to VWAP, and the trend on a higher timeframe. Momentum direction at the moment the squeeze fires is the most reliable directional guide.
Can Keltner Channels be used for day trading?
Yes, Keltner Channels are effective on intraday charts, particularly the 5-minute and 15-minute timeframes. For day trading, consider using a slightly shorter EMA period (10-15) with a 1.5 ATR multiplier for more responsive channels. The squeeze strategy works on intraday charts and can identify high-probability breakout trades during the trading day. Combine with VWAP for intraday trend direction and use the Keltner Channel middle EMA as a reference for intraday support and resistance.
How often do Keltner-Bollinger squeezes occur?
The frequency of squeezes depends on the settings and the instrument. With standard settings (20 EMA, 1.5 ATR Keltner, 20 period 2 SD Bollinger), a typical stock might experience 3-6 squeezes per year on the daily chart. More volatile instruments may squeeze less frequently because their Bollinger Bands rarely contract enough. Less volatile, steady-trending instruments may squeeze more often. Intraday charts produce more frequent squeezes — a stock might squeeze once or twice per week on a 15-minute chart.
Disclaimer
This is educational content, not financial advice. Trading involves risk, and you should consult a qualified financial advisor before making any investment decisions. Past performance does not guarantee future results.
12 chapters covering charts, indicators, risk management & more. Plus weekly trading insights.