Awesome Oscillator: A Momentum Histogram for Trend Confirmation
⚡ Key Takeaways
- The Awesome Oscillator (AO) is a momentum histogram that measures the difference between a 5-period and 34-period simple moving average of bar midpoints.
- Bill Williams developed the AO to show whether bullish or bearish forces are currently driving the market without relying on closing prices.
- The three primary AO signals are the saucer setup, twin peaks, and zero-line crossover, each providing distinct entry conditions.
- Green histogram bars indicate increasing momentum, while red bars indicate decreasing momentum — color changes often precede price reversals.
What Is the Awesome Oscillator?
The Awesome Oscillator (AO) is a momentum indicator created by Bill Williams that compares recent market momentum against a broader momentum baseline. Unlike most oscillators that rely on closing prices, the AO uses the midpoint of each bar — the average of the high and low — to calculate its values.
The result is a histogram that oscillates above and below a zero line. When the histogram is above zero, short-term momentum exceeds long-term momentum, suggesting bullish conditions. When it falls below zero, bearish momentum dominates.
Williams introduced the AO as part of his broader trading system, which also includes the Alligator indicator and the Accelerator Oscillator. The AO sits between these tools as a mid-level momentum gauge — faster than trend-following moving averages but less noisy than ultra-short-term oscillators.
Awesome Oscillator = SMA(5, Midpoint) - SMA(34, Midpoint)How the AO Histogram Works
The AO histogram displays as a series of bars centered on a zero line. Each bar is colored based on its relationship to the previous bar: a bar higher than its predecessor prints green, while a bar lower than its predecessor prints red.
This color coding matters. A stock like AAPL trading in a strong uptrend will show a cluster of green bars above zero. When red bars begin appearing — even while the histogram remains above zero — momentum is weakening before price visibly reverses.
The zero line itself acts as a momentum equilibrium. A cross from below zero to above zero means short-term momentum has overtaken long-term momentum. A cross from above to below signals the opposite shift.
The 5-period and 34-period settings are Williams' defaults and correspond roughly to one trading week and seven trading weeks. These are not arbitrary — they capture the tension between immediate buying pressure and the broader market rhythm. Most traders leave these settings unchanged, though shorter timeframe traders occasionally experiment with faster periods.
Saucer Signal
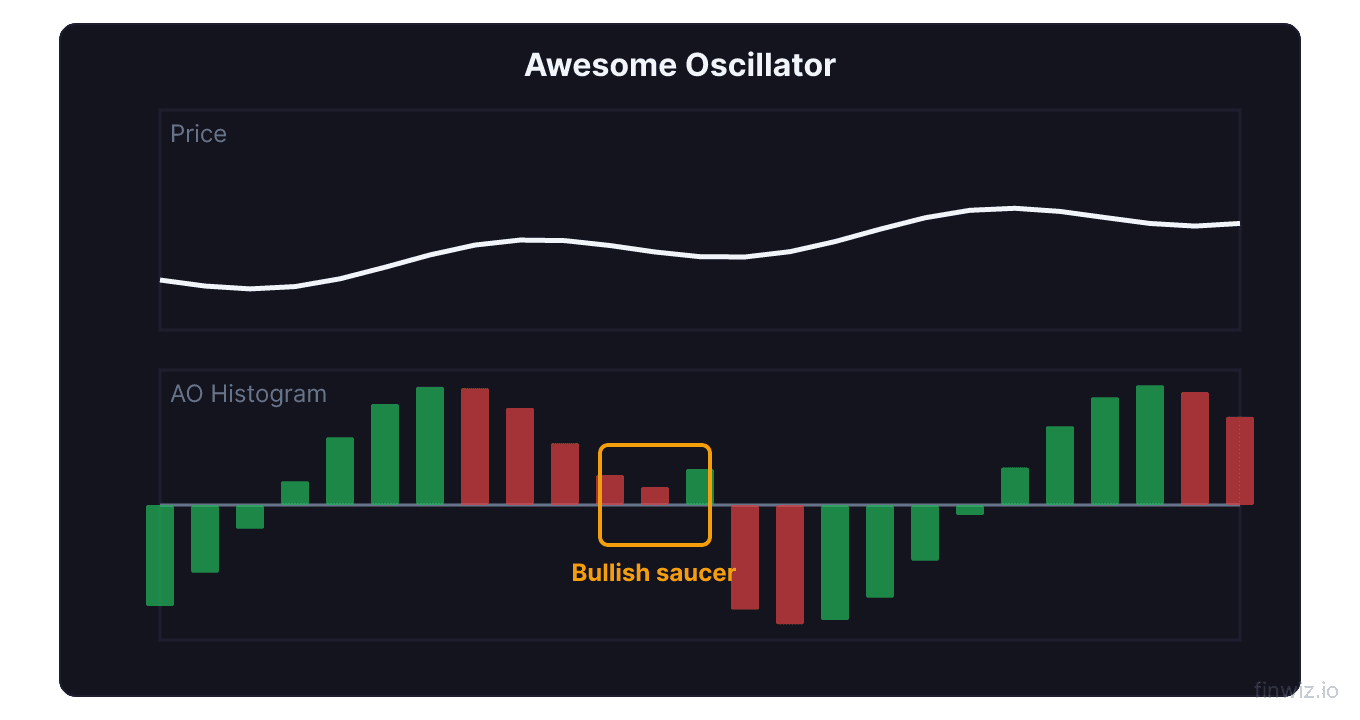
The saucer is the AO's most common trade signal and occurs entirely on one side of the zero line.
For a bullish saucer, the AO must be above zero. The pattern requires three consecutive histogram bars: the first is red (declining), the second is red but shorter than the first (deceleration), and the third flips to green (acceleration). This three-bar sequence signals that a temporary momentum pullback within a bullish trend has ended.
The bearish saucer is the mirror image below zero: a green bar followed by a shorter green bar followed by a red bar.
In practice, traders using MSFT or NVDA on a daily chart will see saucer setups form during consolidation periods within established trends. The saucer catches the moment when the dip loses steam and buying pressure resumes.
Pro Tip
Twin Peaks Signal
The twin peaks signal is a divergence pattern that catches trend reversals.
A bullish twin peaks forms when the AO creates two consecutive troughs below zero, where the second trough is shallower (closer to zero) than the first, followed by a green bar. This shows that bearish momentum made a lower push on its first attempt but could not match that intensity on its second — a classic loss of selling conviction.
A bearish twin peaks forms above zero with two peaks, where the second peak is lower than the first, followed by a red bar. Tesla (TSLA) displayed a textbook bearish twin peaks on its daily chart during several of its major 2022 reversals, as rally momentum faded across successive pushes higher.
The twin peaks signal is slower to develop than the saucer but produces higher-probability reversals because it requires confirmed divergence rather than a simple momentum pause.
Zero-Line Crossover
The zero-line crossover is the simplest AO signal. A cross from below zero to above zero generates a buy signal. A cross from above zero to below zero generates a sell signal.
This signal is less nuanced than the saucer or twin peaks and produces more whipsaws in range-bound markets. It works best as a trend filter: if the AO is above zero, favor long setups from other indicators like MACD or stochastic. If below zero, favor shorts or stand aside.
Combining the zero-line crossover with the ADX helps filter false signals. When ADX is above 25 (confirming a trending environment), zero-line crossovers become significantly more reliable than during low-ADX choppy conditions.
AO Trading Strategies
Trend continuation with saucer entries. In a confirmed uptrend, wait for the AO to remain above zero and form a bullish saucer. Enter long on the green bar with a stop below the recent swing low. This approach keeps you trading with the trend and uses momentum confirmation for timing.
Reversal trading with twin peaks. When a stock has been trending and the AO forms twin peaks divergence, prepare for a reversal entry. Wait for the confirming bar (green after bullish twin peaks, red after bearish twin peaks) before entering. Place stops beyond the most recent extreme.
Multi-timeframe confirmation. Check the AO on a higher timeframe (weekly) for trend direction and use the lower timeframe (daily) for entry signals. If the weekly AO is above zero and the daily AO forms a bullish saucer, the trade has momentum alignment across timeframes.
AO vs. MACD
Both the AO and MACD measure momentum using moving average differences, but they diverge in construction. The MACD uses exponential moving averages of closing prices, making it more responsive to recent price action. The AO uses simple moving averages of midpoints, giving it a smoother, less reactive character.
The MACD includes a signal line that generates crossover signals, while the AO relies on histogram patterns. In practice, the MACD is better for catching the early stages of momentum shifts, while the AO excels at confirming momentum within established trends.
Many traders run both simultaneously — using the MACD for initial signal detection and the AO for confirmation before entry.
Frequently Asked Questions
What timeframe works best for the Awesome Oscillator?
The AO works on all timeframes, but daily and 4-hour charts provide the cleanest signals. On timeframes below 15 minutes, the histogram becomes noisy and produces frequent false saucer and twin peaks patterns. Swing traders on daily charts get the best balance of signal quality and trade frequency.
Can the Awesome Oscillator be used as a standalone indicator?
Williams designed it as part of a complete system, and using it standalone increases false signals. Pair the AO with trend identification tools like moving averages or the ADX to filter signals. The AO tells you about momentum strength, but it does not define trend direction or identify support and resistance levels on its own.
How does the Awesome Oscillator handle ranging markets?
Poorly. In sideways markets, the AO oscillates around the zero line and generates repeated false crossovers and incomplete saucer patterns. Use the ADX to confirm a trending environment before acting on AO signals. If ADX is below 20, ignore AO crossovers and wait for a trend to establish itself.
12 chapters covering charts, indicators, risk management & more. Plus weekly trading insights.