Force Index: Combining Price & Volume for Trade Signals
⚡ Key Takeaways
- The Force Index, developed by Dr. Alexander Elder, quantifies the force behind price moves by multiplying the price change by volume — capturing both direction and conviction in a single value.
- The raw (1-period) Force Index is extremely volatile; traders typically smooth it with a 2-period EMA for short-term signals or a 13-period EMA for intermediate-term trend confirmation.
- A 2-period Force Index crossing below zero in an uptrend identifies short-term pullback buying opportunities, while crossing above zero in a downtrend identifies short-selling opportunities.
- The 13-period Force Index confirms the intermediate trend: persistent positive readings confirm bullish momentum, while persistent negative readings confirm bearish momentum.
- Force Index divergence from price — particularly when the 13-period version makes lower highs while price makes higher highs — warns of weakening momentum and potential reversal.
What Is the Force Index?
The Force Index is a technical oscillator developed by Dr. Alexander Elder that measures the force (or power) behind each price movement by combining three critical elements: the direction of the price change, the magnitude of the change, and the volume that accompanied it.
The concept is intuitive: a large price increase on heavy volume represents a powerful bullish force, while a small price decline on light volume represents a weak bearish force. By quantifying this relationship, the Force Index reveals the conviction behind each session's price action.
The Force Index is part of Dr. Elder's broader analytical framework that includes the Elder-Ray Index and the Triple Screen trading system. While the Elder-Ray separates bull and bear power, the Force Index combines them into a single net force measurement.
The Force Index Formula
The raw Force Index is calculated in a single step.
Force Index (1-period) = (Close today - Close yesterday) × Volume todayBreaking Down the Components
Price change (Close - Prior Close): Determines the direction and magnitude. A $2 increase contributes more force than a $0.50 increase. The sign (positive or negative) determines whether the force is bullish or bearish.
Volume: Acts as the multiplier. The same $1 price increase on 5 million shares produces five times the force of the same move on 1 million shares. Volume represents the conviction behind the move.
Why the Raw Force Index Is Too Volatile
The 1-period (raw) Force Index fluctuates wildly between positive and negative values on a daily basis because it reflects a single session's price change and volume. This makes the raw version nearly impossible to use for trading signals. Dr. Elder recommends smoothing the Force Index with an exponential moving average (EMA) to create usable signals.
Pro Tip
The 2-Period Force Index: Short-Term Signal
The 2-period EMA of the Force Index is the short-term version used for tactical entries and exits.
How It Works
By applying a 2-period EMA to the raw Force Index, you create a smoothed oscillator that oscillates around zero. Despite the smoothing, the 2-period version remains highly responsive to short-term shifts in buying and selling pressure.
Buy Signals (2-Period)
The most effective use of the 2-period Force Index is identifying pullback buying opportunities in uptrends:
- Confirm the trend is up using a longer-term tool (13-EMA, moving average direction, or MACD)
- Wait for the 2-period Force Index to drop below zero (short-term selling pressure during the pullback)
- Enter long when the Force Index turns back up from below zero, or use a buy stop above the current bar's high
- Place stop below the pullback low
Sell Signals (2-Period)
For short entries in downtrends:
- Confirm the trend is down
- Wait for the 2-period Force Index to rise above zero (short-term buying pressure during the bounce)
- Enter short when the Force Index turns back down from above zero
- Place stop above the bounce high
| Signal | Trend Direction | 2-Period Force Index | Action |
|---|---|---|---|
| Buy pullback | Uptrend | Drops below zero, turns up | Enter long |
| Sell bounce | Downtrend | Rises above zero, turns down | Enter short |
| Strong buying | Uptrend | Spikes high above zero | Momentum confirmation (hold) |
| Strong selling | Downtrend | Spikes deep below zero | Momentum confirmation (hold short) |
The 13-Period Force Index: Intermediate-Term Trend
The 13-period EMA of the Force Index is the intermediate-term version used for trend confirmation and broader analysis.
How It Works
The 13-period smoothing produces a slower, more stable oscillator that reflects the intermediate-term balance between bullish and bearish force. It oscillates around zero, with sustained readings on one side confirming the trend direction.
Interpreting 13-Period Readings
Persistent positive readings: The intermediate trend is bullish. Volume-weighted buying pressure has dominated over the past 13 periods. This confirms that the uptrend has genuine volume support.
Persistent negative readings: The intermediate trend is bearish. Volume-weighted selling pressure dominates.
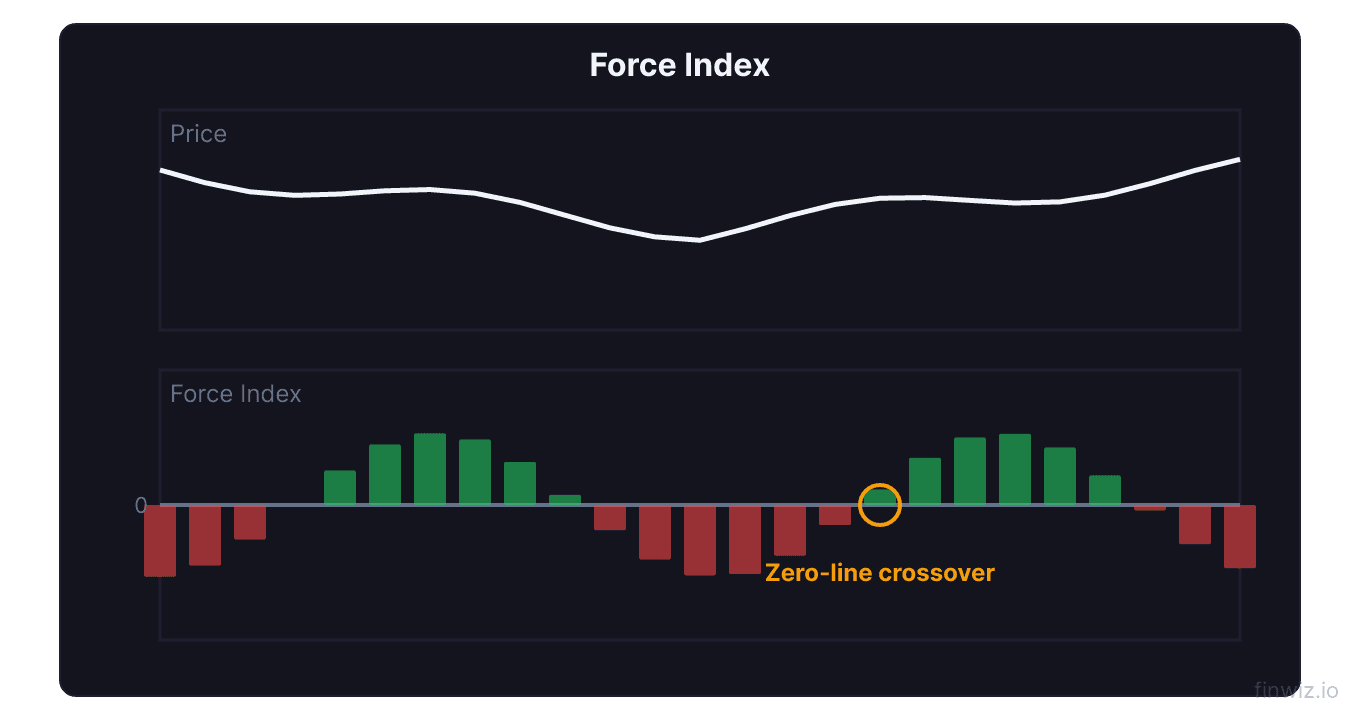
Zero-line crossovers: When the 13-period Force Index crosses from negative to positive (or vice versa), it signals a potential shift in the intermediate trend. These crossovers are the 13-period version's primary signals.
Trend Health Assessment
The 13-period Force Index also reveals trend health:
- Rising Force Index during an uptrend: Healthy, strengthening trend — bullish force is increasing
- Declining Force Index during an uptrend: Weakening trend — bullish force is fading despite higher prices
- Falling Force Index during a downtrend: Healthy, strengthening downtrend
- Rising Force Index during a downtrend: Weakening downtrend — bearish force is fading
Pro Tip
Force Index Divergence
Divergence between the Force Index and price provides early warning of potential trend changes.
Bullish Divergence
Price makes a lower low while the Force Index (13-period) makes a higher low. Despite new price lows, the volume-weighted selling force is actually weakening. This suggests that the decline is losing conviction and a reversal may be developing.
Bullish Force Index divergence is particularly significant when it develops at key support levels, near oversold RSI readings, or at the completion zone of chart patterns like double bottoms.
Bearish Divergence
Price makes a higher high while the Force Index (13-period) makes a lower high. The advance is occurring with diminishing volume-weighted force. This warns that the rally is losing conviction.
Bearish divergence at resistance levels, after extended rallies, or during the formation of patterns like head and shoulders or triple tops provides strong reversal warnings.
Divergence vs. Confirmation
| Price Action | 13-Period Force Index | Interpretation |
|---|---|---|
| Higher highs | Higher highs | Trend confirmed — healthy uptrend |
| Higher highs | Lower highs | Bearish divergence — trend weakening |
| Lower lows | Lower lows | Trend confirmed — healthy downtrend |
| Lower lows | Higher lows | Bullish divergence — trend weakening |
Trading Strategies with the Force Index
Strategy 1: Triple Screen with Force Index
This applies Dr. Elder's Triple Screen framework using the Force Index:
Screen 1 (Weekly chart): Identify the trend using the weekly 13-period Force Index. Above zero = bullish bias. Below zero = bearish bias.
Screen 2 (Daily chart): Use the daily 2-period Force Index to find pullback entries. In a weekly uptrend, buy when the daily 2-period drops below zero. In a weekly downtrend, short when the daily 2-period rises above zero.
Screen 3 (Entry): Use a trailing buy stop (uptrend) or trailing sell stop (downtrend) just beyond the prior session's high or low.
Strategy 2: Force Index Spike Trading
Extremely large Force Index readings (spikes) often signal exhaustion rather than continuation:
- A massive positive spike may signal a buying climax — short-term top
- A massive negative spike may signal a selling climax — short-term bottom
Define "extreme" relative to the recent history of Force Index readings. When the current reading is more than 2-3 standard deviations from the mean, it qualifies as a spike.
Strategy 3: Zero-Line Crossover (13-Period)
A simple trend-following strategy:
- Go long when the 13-period Force Index crosses above zero (buy on confirmed bullish force)
- Go short when it crosses below zero (sell on confirmed bearish force)
- Exit when the indicator crosses back through zero
This strategy works best in trending markets. Add a moving average filter (e.g., trade only in the direction of the 50-day MA) to reduce whipsaws.
Force Index vs. Other Volume Indicators
| Indicator | Measures | Bounded? | Smoothed? | Primary Use |
|---|---|---|---|---|
| Force Index | Price change × Volume | No | Yes (via EMA) | Force behind moves |
| OBV | Cumulative volume direction | No | No (cumulative) | Volume trend |
| A/D Line | CLV × Volume (cumulative) | No | No (cumulative) | Smart money tracking |
| MFI | Typical price × Volume ratio | Yes (0-100) | Yes (period-based) | Overbought/oversold volume |
| CMF | CLV × Volume (period average) | Yes (-1 to +1) | Yes (period-based) | Money flow direction |
The Force Index is unique because it directly multiplies price change by volume, capturing the raw momentum × participation dynamic that other indicators approach less directly. OBV and A/D use directional classification. MFI and CMF use ratio-based normalization. The Force Index uses multiplication, making it the most direct measure of the force behind each move.
Period Settings
| Setting | Smoothing | Use Case | Sensitivity |
|---|---|---|---|
| 1 (raw) | None | Analysis only (too volatile to trade) | Maximum |
| 2 | 2-period EMA | Short-term entries and exits | High |
| 13 | 13-period EMA | Intermediate trend confirmation | Moderate |
| 26 | 26-period EMA | Longer-term trend assessment | Low |
| 50+ | 50-period EMA | Position trading | Very low |
Dr. Elder recommends primarily using the 2-period and 13-period versions. The 2-period captures short-term force shifts for timing, while the 13-period captures the intermediate-term force balance for direction.
Limitations
Sensitive to volume spikes. A single session with unusually high volume (earnings, news events) can distort the Force Index dramatically, even with EMA smoothing. Be cautious interpreting signals immediately following volume spikes.
Not bounded. The Force Index has no fixed overbought/oversold levels. Extreme readings depend on the specific security's typical price changes and volume levels. What is "extreme" for one stock may be normal for another.
Requires trending markets. Like most momentum indicators, the Force Index produces whipsaw signals in range-bound markets. The 2-period version crosses zero frequently in choppy conditions, generating false entries.
Volume data dependency. The indicator requires reliable volume data. In markets where volume is fragmented (OTC markets) or estimated (forex tick volume), the Force Index may not accurately capture true buying and selling force.
Frequently Asked Questions
What is the difference between Force Index and Elder-Ray?
Both were developed by Dr. Elder but measure different things. The Force Index measures the net force behind price moves using price change multiplied by volume. The Elder-Ray Index separates Bull Power (high minus EMA) and Bear Power (low minus EMA) to measure each side's strength relative to the moving average. The Force Index focuses on net momentum, while Elder-Ray focuses on the balance of power.
Can the Force Index be used alone?
Dr. Elder designed the Force Index to work within his Triple Screen system, not as a standalone indicator. Used alone, it produces too many false signals. Combine it with a trend filter (moving average direction, weekly trend analysis) and use the 2-period version only for timing entries within the confirmed trend.
What happens when the Force Index is at zero?
A Force Index reading of zero means either the price did not change (close equals prior close) or the smoothed average of recent force values nets out to zero. In the 13-period version, a zero reading indicates that bullish and bearish forces are balanced — a neutral, transitional state.
Is the Force Index available on TradingView?
Yes, the Force Index is available on most charting platforms including TradingView, MetaTrader, and Thinkorswim. On TradingView, search for "Force Index" in the indicators panel. You can adjust the EMA period to 2 or 13 based on your preferred timeframe.
How do I identify Force Index spikes?
Look for readings that are 2-3 times larger than recent readings (compare to the 20-session average of absolute Force Index values). Alternatively, apply Bollinger Bands to the Force Index itself — readings beyond the bands indicate extreme force levels.
Which markets work best with the Force Index?
The Force Index works best in markets with reliable volume data and clear trending tendencies: actively traded stocks, ETFs, and futures. It is less reliable in forex (where tick volume is a proxy for true volume) and thinly traded securities where a few large orders can dominate the volume profile.
Disclaimer
This is educational content, not financial advice. Trading involves risk, and you should consult a qualified financial advisor before making any investment decisions. Past performance does not guarantee future results.
Related Articles
12 chapters covering charts, indicators, risk management & more. Plus weekly trading insights.