Money Flow Index (MFI): Volume-Weighted RSI Explained
⚡ Key Takeaways
- The Money Flow Index (MFI) is a volume-weighted momentum oscillator that ranges from 0 to 100, often called the
- because it incorporates volume into the RSI framework.
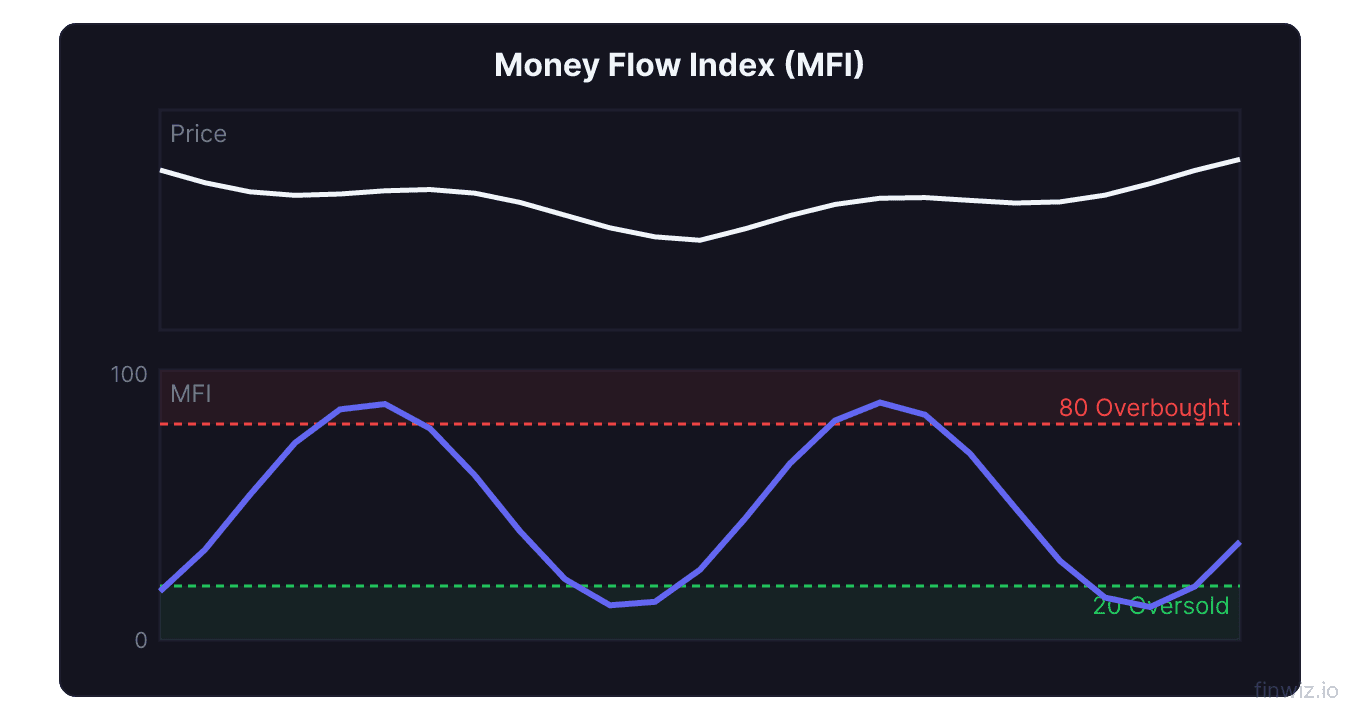
- MFI uses a 14-period default and identifies overbought conditions above 80 and oversold conditions below 20, with volume data adding a layer of conviction beyond standard RSI.
- Divergence between MFI and price is a powerful signal: bullish divergence (price lower, MFI higher) warns of potential reversal upward; bearish divergence signals potential reversal downward.
- Because MFI includes volume, it can detect shifts in institutional behavior that pure price-based oscillators like RSI miss.
- MFI works best on daily and weekly charts for swing and position trading, and is most reliable when combined with price pattern analysis and trend indicators.
What Is the Money Flow Index?
The Money Flow Index (MFI) is a momentum oscillator that incorporates both price and volume to measure buying and selling pressure. Developed by Gene Quong and Avrum Soudack, the MFI is often described as the volume-weighted RSI because its calculation mirrors the Relative Strength Index (RSI) but adds volume as a weighting factor.
The MFI oscillates between 0 and 100. Readings above 80 indicate overbought conditions (excessive buying pressure), while readings below 20 indicate oversold conditions (excessive selling pressure). Unlike RSI, which considers only price changes, MFI weighs those changes by the volume that accompanied them, providing a more complete picture of the conviction behind price movements.
The logic is compelling: a price increase on heavy volume represents stronger buying conviction than the same price increase on light volume. By incorporating volume, MFI differentiates between price moves driven by genuine institutional participation and those driven by thin liquidity.
The MFI Formula
The MFI calculation is a multi-step process that builds from typical price to the final oscillator value.
Step 1: Typical Price
Typical Price = (High + Low + Close) / 3The typical price represents the session's average price level.
Step 2: Raw Money Flow
Raw Money Flow = Typical Price × VolumeRaw Money Flow combines price and volume into a single value. The directional comparison determines whether each session's money flow is classified as positive (buying) or negative (selling).
Step 3: Money Flow Ratio
Money Flow Ratio = Sum of Positive Money Flow over N periods / Sum of Negative Money Flow over N periodsStep 4: Money Flow Index
MFI = 100 - (100 / (1 + Money Flow Ratio))This final formula mirrors the RSI formula exactly, substituting money flow for price change. The result is a bounded oscillator from 0 to 100.
Pro Tip
Overbought and Oversold Levels
Overbought (MFI Above 80)
When MFI rises above 80, the security has experienced sustained buying pressure supported by volume. This signals that the current advance may be overextended and that a pullback or reversal could be imminent.
However, overbought does not automatically mean "sell." In strong uptrends, MFI can remain above 80 for extended periods. The signal becomes actionable when:
- MFI turns down from above 80 (crosses below 80)
- Bearish divergence develops between MFI and price
- Price reaches a known resistance level
- Bearish candlestick patterns like shooting stars or hanging man appear
Oversold (MFI Below 20)
When MFI drops below 20, the security has experienced sustained selling pressure on volume. This signals that the decline may be overextended and a bounce could develop.
The oversold signal becomes actionable when:
- MFI turns up from below 20 (crosses above 20)
- Bullish divergence develops between MFI and price
- Price reaches a known support level
- Bullish candlestick patterns like hammers or engulfing patterns appear
| MFI Zone | Reading | Interpretation | Action |
|---|---|---|---|
| Extreme overbought | 90-100 | Very heavy buying, exhaustion likely | Prepare for reversal |
| Overbought | 80-90 | Strong buying pressure | Watch for weakness |
| Neutral-bullish | 50-80 | Moderate buying bias | Trend continuation |
| Neutral | 45-55 | Balanced | No directional signal |
| Neutral-bearish | 20-50 | Moderate selling bias | Trend continuation |
| Oversold | 10-20 | Strong selling pressure | Watch for strength |
| Extreme oversold | 0-10 | Very heavy selling, exhaustion likely | Prepare for reversal |
MFI Divergence
Divergence between MFI and price is the indicator's most reliable reversal signal because it reveals when volume-weighted momentum contradicts the price trend.
Bullish Divergence
Price makes a lower low while MFI makes a higher low. This is particularly powerful because it tells you that despite lower prices, the volume-weighted buying pressure is actually increasing. Sellers are losing conviction on a volume basis.
Bullish MFI divergence at key support levels, Fibonacci retracement zones, or the completion of chart patterns like double bottoms provides high-probability reversal signals.
Bearish Divergence
Price makes a higher high while MFI makes a lower high. The advance is occurring on diminishing volume-weighted momentum. Even though prices are higher, the buying conviction (as measured by volume) is weaker. This frequently precedes significant declines.
Bearish MFI divergence at resistance levels, near the completion of patterns like head and shoulders or triple tops, provides strong reversal warnings.
Pro Tip
MFI vs. RSI: A Detailed Comparison
Since MFI is often called the "volume-weighted RSI," understanding their differences helps you decide when each is more appropriate.
| Feature | MFI | RSI |
|---|---|---|
| Inputs | Typical price + volume | Close price only |
| Volume consideration | Yes (core component) | No |
| Default period | 14 | 14 |
| Overbought/Oversold | 80/20 | 70/30 |
| Sensitivity | Less sensitive (volume smoothing) | More sensitive to price changes |
| False signals | Fewer (volume filter) | More common |
| Best markets | High-volume stocks, futures | Any market |
| Divergence quality | Higher (volume-weighted) | Good |
When MFI Is Better Than RSI
MFI outperforms RSI when volume analysis matters — specifically in stock markets where institutional trading produces meaningful volume patterns. MFI is better at detecting:
- Smart money accumulation or distribution
- Volume-confirmed breakouts versus low-volume false moves
- Institutional participation shifts at market turning points
When RSI Is Better Than MFI
RSI is more appropriate in markets where volume data is unreliable or unavailable, such as forex (where true volume is decentralized) or when analyzing long-term weekly charts where volume patterns become noisy.
Trading Strategies with MFI
Overbought/Oversold Reversal Strategy
- Wait for MFI to reach extreme overbought (above 90) or extreme oversold (below 10)
- Look for a reversal candlestick pattern at the extreme
- Enter when MFI crosses back through the 80 or 20 level
- Set stop loss beyond the extreme price reached during the overbought/oversold reading
- Target the nearest support/resistance level or use a 2:1 risk-reward ratio
Divergence Strategy
- Identify MFI divergence from price over at least 10-15 sessions
- Confirm with a second indicator — MACD divergence, A/D line divergence, or a candlestick reversal pattern
- Enter when price confirms the reversal direction (breaks a minor support/resistance level in the divergence direction)
- Place stop beyond the price extreme
- Target the previous swing high/low
Trend Confirmation Strategy
Use MFI as a filter for other trading signals:
- Only take long signals (breakouts, pullback entries, pattern completions) when MFI is above 50
- Only take short signals when MFI is below 50
- Avoid all signals when MFI is crossing rapidly back and forth across 50 (choppy market)
MFI Settings and Optimization
Period Adjustments
The 14-period default works well for standard swing trading on daily charts. Consider adjustments based on your timeframe:
- 7-10 periods: More sensitive, suitable for shorter-term trades and faster-moving markets
- 14 periods: Standard, balanced sensitivity
- 20-28 periods: Smoother, fewer signals, suitable for position trading
Threshold Adjustments
In strongly trending markets, consider widening the thresholds:
- Uptrend: Use 90/10 instead of 80/20 to avoid premature reversal signals
- Downtrend: Same wider thresholds apply
In range-bound markets, the standard 80/20 levels work well for identifying range extremes.
Limitations
Volume data dependency. MFI requires reliable volume data. In forex markets, where volume is fragmented across dealers, MFI calculations use tick volume as a proxy, which may not accurately represent true money flow.
Lag. Like all period-based oscillators, MFI introduces lag. The 14-period calculation means that MFI reflects the average money flow over the past 14 sessions, which may not capture rapid shifts in sentiment.
Not effective in all markets. MFI works best in liquid, actively traded markets where volume genuinely reflects participant behavior. In thinly traded stocks, ETFs, or markets with manipulated volume, MFI signals are less reliable.
Can stay extreme in strong trends. In powerful trending moves, MFI can remain overbought or oversold for extended periods, generating false reversal signals for traders who rely solely on extreme readings.
Frequently Asked Questions
Is MFI better than RSI?
Neither is universally better — they complement each other. MFI is superior when volume analysis adds value (high-volume stocks, breakout confirmation). RSI is superior when volume data is unreliable (forex) or when you need faster, more responsive signals. Many traders use both together for comprehensive analysis.
What is the best MFI setting?
The 14-period default is the most widely used and tested setting. For day trading, consider 7-10 periods. For position trading, try 20-28 periods. Always backtest any setting change on your specific market and timeframe before trading with real capital.
How do I use MFI with moving averages?
A common approach: use a 50-day moving average for trend direction and MFI for timing. Only take long MFI signals (oversold bounces, bullish divergence) when price is above the 50-day MA. Only take short signals when price is below the 50-day MA.
Can MFI predict breakouts?
MFI can help validate breakouts rather than predict them. A breakout from a chart pattern accompanied by MFI rising above 60-70 (showing strong buying pressure on volume) is more likely to succeed than a breakout with MFI near 50 or below. Use MFI as a breakout confirmation filter alongside volume analysis.
What does an MFI reading of exactly 50 mean?
An MFI of 50 indicates that positive and negative money flows are perfectly balanced over the lookback period. This is a neutral reading that suggests no directional bias. Markets with MFI near 50 are often in consolidation or transition phases.
How does MFI handle gaps?
MFI uses typical price (average of high, low, close) for its directional comparison. Gap-ups generally increase the typical price above the prior session's, registering as positive money flow. Gap-downs generally decrease it, registering as negative money flow. However, the impact depends on the full session's range, not just the gap.
Disclaimer
This is educational content, not financial advice. Trading involves risk, and you should consult a qualified financial advisor before making any investment decisions. Past performance does not guarantee future results.
Related Articles
12 chapters covering charts, indicators, risk management & more. Plus weekly trading insights.