CCI Indicator: Commodity Channel Index for Momentum Trading
⚡ Key Takeaways
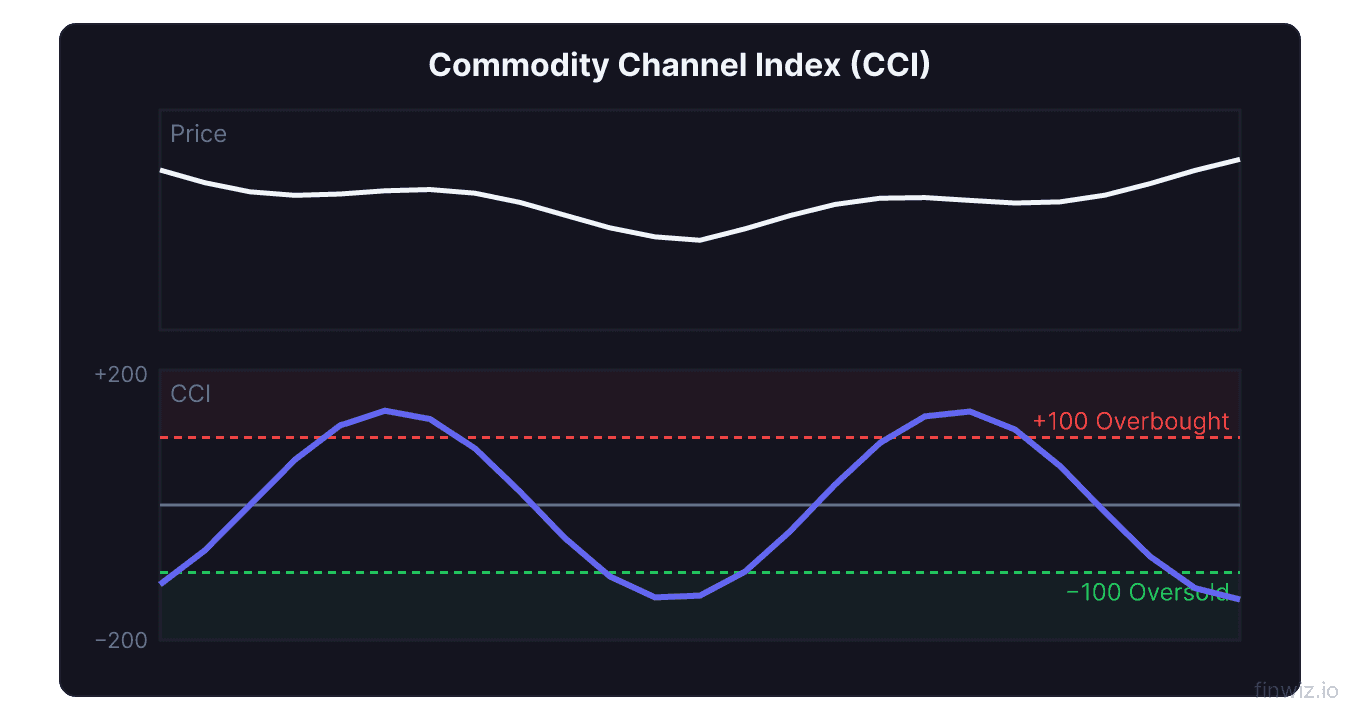
- The Commodity Channel Index (CCI) measures how far price has deviated from its statistical mean, with readings above +100 indicating overbought and below -100 indicating oversold conditions
- CCI was originally developed for commodities by Donald Lambert in 1980 but is now widely used across stocks, ETFs, and forex
- The standard 20-period setting captures roughly one month of trading data, while a 14-period setting provides faster signals for more active traders
- CCI divergence from price is one of its strongest signals, often preceding reversals by several bars
- Unlike RSI, CCI has no fixed upper or lower boundary, making it better suited for identifying extreme momentum conditions in strongly trending markets
What Is the CCI Indicator?
The Commodity Channel Index (CCI) is a versatile momentum oscillator that measures the difference between a security's current price and its historical average price. When CCI is high, price is well above its average, suggesting overbought conditions. When CCI is low, price is well below its average, suggesting oversold conditions.
Developed by Donald Lambert in 1980, CCI was originally designed to identify cyclical turns in commodity markets. However, traders quickly discovered that it works equally well on stocks, indices, ETFs, and forex pairs. The indicator oscillates around a zero line, with the +100 and -100 levels serving as the primary signal thresholds.
CCI differs from bounded oscillators like RSI because it has no fixed upper or lower limit. During strong trends, CCI can reach +300, +400, or even higher. This unbounded nature makes CCI particularly useful for identifying extreme momentum conditions that bounded indicators may miss.
The CCI Formula
The CCI formula calculates how far the Typical Price has deviated from its simple moving average, normalized by the mean deviation.
Typical Price (TP) = (High + Low + Close) / 3Lambert chose the 0.015 constant specifically so that normal price fluctuations would keep CCI between -100 and +100 approximately 70-80% of the time. When CCI moves outside this range, the price has moved significantly from its average, indicating a potentially tradable condition.
The use of Typical Price (the average of high, low, and close) rather than just the closing price gives CCI a more complete picture of each period's price action. This makes CCI slightly less sensitive to closing price manipulation.
Interpreting CCI Levels
Understanding what different CCI levels mean helps you contextualize the indicator's readings.
The Zero Line
When CCI is at zero, the current typical price equals its moving average exactly. CCI above zero means price is above its average (bullish bias), and CCI below zero means price is below its average (bearish bias).
Zero-line crossovers serve as basic trend signals. CCI crossing above zero suggests bullish momentum is developing, while crossing below zero suggests bearish momentum. These are useful as trend filters: only take long trades when CCI is above zero, and only take short trades when CCI is below zero.
The +100 Level
When CCI crosses above +100, price has moved significantly above its mean, indicating strong upward momentum. This can be interpreted two ways depending on the market context:
- In a developing trend: CCI above +100 confirms that bullish momentum is strong and the trend is likely to continue.
- After an extended move: CCI above +100 may indicate overbought conditions and a potential pullback.
The -100 Level
When CCI drops below -100, price has moved significantly below its mean. Like the +100 level, this has dual interpretations:
- In a developing downtrend: CCI below -100 confirms strong bearish momentum.
- After an extended decline: CCI below -100 may indicate oversold conditions and a potential bounce.
Pro Tip
CCI Trading Strategies
The +100/-100 Breakout Strategy
The simplest CCI strategy involves buying when CCI crosses above +100 and selling when it crosses back below +100. For short trades, sell when CCI drops below -100 and cover when it crosses back above -100.
This strategy works best in trending markets. In range-bound markets, it generates frequent whipsaw signals as CCI oscillates around the +100 and -100 levels.
Zero-Line Crossover Strategy
A more conservative approach uses the zero line for signals. Buy when CCI crosses above zero and sell when it crosses below. This produces fewer signals and captures larger moves but with later entries and exits.
The CCI Pullback Strategy
In a confirmed uptrend (CCI recently above +100), wait for CCI to pull back toward the zero line or slightly below. Enter long when CCI turns back upward from this pullback zone. This captures trend continuation moves with favorable risk-to-reward ratios.
CCI Divergence
CCI divergence is one of the most powerful signals the indicator produces.
Bullish divergence: Price makes a lower low, but CCI makes a higher low. Selling pressure is weakening despite new price lows, suggesting a potential reversal.
Bearish divergence: Price makes a higher high, but CCI makes a lower high. Buying momentum is fading despite new price highs.
Divergence signals are more reliable when CCI is in extreme territory (beyond +200 or below -200) and when confirmed by other indicators like MACD divergence or volume patterns.
CCI Settings: 14 vs. 20 Period
The choice between a 14-period and 20-period CCI depends on your trading style and timeframe.
| Setting | Responsiveness | Signal Frequency | Best For |
|---|---|---|---|
| 14-period | Faster | More signals, more noise | Swing trading, active trading |
| 20-period (default) | Standard | Balanced | All-purpose, Lambert's original |
| 50-period | Slower | Fewer signals, more reliable | Position trading, trend identification |
14-period CCI crosses the +100 and -100 levels more frequently, providing earlier signals but also more false breakouts. Day traders and aggressive swing traders often prefer this setting.
20-period CCI is Lambert's original setting and remains the most widely used. It captures approximately one month of trading data on a daily chart, providing a good balance between responsiveness and reliability.
Longer periods (30, 50, or 100) smooth CCI significantly and are useful for identifying the primary trend. Some traders use a dual CCI approach: a longer-period CCI for trend direction and a shorter-period CCI for entry timing.
Pro Tip
CCI vs. RSI
Both CCI and RSI are momentum oscillators, but they differ in important ways.
| Feature | CCI | RSI |
|---|---|---|
| Range | Unbounded (-infinity to +infinity) | Bounded (0 to 100) |
| Calculation | Distance from mean price | Ratio of up moves to down moves |
| Overbought Level | +100 (but can exceed significantly) | 70 |
| Oversold Level | -100 (but can drop much further) | 30 |
| Best In | Trending markets, identifying extremes | Range-bound markets, mean reversion |
| Default Period | 20 | 14 |
CCI's advantage is its unbounded nature. In powerful trends, RSI can sit at 70-80 for weeks, providing limited information. CCI, however, continues to rise to +200, +300, or higher, giving you a better sense of how extreme the momentum really is.
RSI's advantage is its bounded scale, making it easier to compare across different securities and timeframes. RSI's 30/70 levels have a consistent meaning regardless of the asset being analyzed.
Many traders use both indicators together: RSI for identifying overbought/oversold conditions in ranging markets, and CCI for measuring momentum strength in trending markets.
Real-World CCI Example
Consider a swing trade on Microsoft (MSFT) in mid-2023. MSFT had been trending higher, with the 50-day SMA above the 200-day SMA (a golden cross in effect).
After a strong rally, the 20-period CCI reached +250, indicating extremely strong but potentially overextended momentum. Over the next two weeks, MSFT made a marginal new high, but CCI peaked at only +180, forming a bearish divergence.
The stock subsequently pulled back about 8% over the following three weeks, with CCI declining to near -100. When CCI turned back up from -100 while the stock remained above its 200-day moving average, it presented a pullback buying opportunity within the larger uptrend.
This example illustrates CCI's strength: identifying momentum extremes and divergences within the context of the broader trend.
Common CCI Mistakes
Trading CCI overbought/oversold in strong trends. Selling just because CCI is above +100 in a strong uptrend will repeatedly put you on the wrong side. In trending markets, use CCI pullbacks to the zero line as buying opportunities, not CCI readings above +100 as sell signals.
Ignoring the broader context. CCI should be used alongside trend identification tools like moving averages, ADX, or Bollinger Bands. A CCI signal has different implications depending on whether the market is trending or range-bound.
Using CCI alone for entry and exit. Like all single indicators, CCI produces false signals. Combine it with price action analysis, support and resistance levels, and volume confirmation for more reliable trading decisions.
FAQ
What is the best CCI setting for day trading?
For day trading on intraday charts, a 14-period CCI provides faster signals that suit shorter timeframes. Some day traders use even shorter settings (9 or 10 periods) on 5-minute or 15-minute charts, though shorter settings increase noise. Always combine with volume analysis for confirmation.
Can CCI be used on any market?
Yes. Despite its name referencing commodities, CCI works on any market with open-high-low-close data, including stocks, ETFs, forex, futures, and cryptocurrencies. The calculation is based on statistical deviation from the mean, which is a universal concept.
What does a CCI reading of +300 mean?
A CCI reading of +300 means the current typical price is three times the normal deviation above its moving average. This indicates extremely strong bullish momentum. While it may seem overbought, in powerful trends CCI can remain elevated for extended periods before the price reverses.
How is CCI different from Bollinger Bands?
Both CCI and Bollinger Bands measure deviation from a moving average, but they display the information differently. Bollinger Bands overlay directly on the price chart with bands that expand and contract. CCI appears as a separate oscillator below the chart. CCI uses mean deviation while Bollinger Bands use standard deviation.
Should I use CCI or RSI?
Neither is universally better. Use CCI when you need to measure how extreme momentum is in trending markets, since its unbounded nature provides more information in strong trends. Use RSI when trading mean-reversion strategies in range-bound markets. Using both together provides a more complete picture.
Disclaimer
This is educational content, not financial advice. Trading involves risk, and you should consult a qualified financial advisor before making any investment decisions. Past performance does not guarantee future results.
Related Articles
12 chapters covering charts, indicators, risk management & more. Plus weekly trading insights.