ADX Indicator: How to Measure Trend Strength
⚡ Key Takeaways
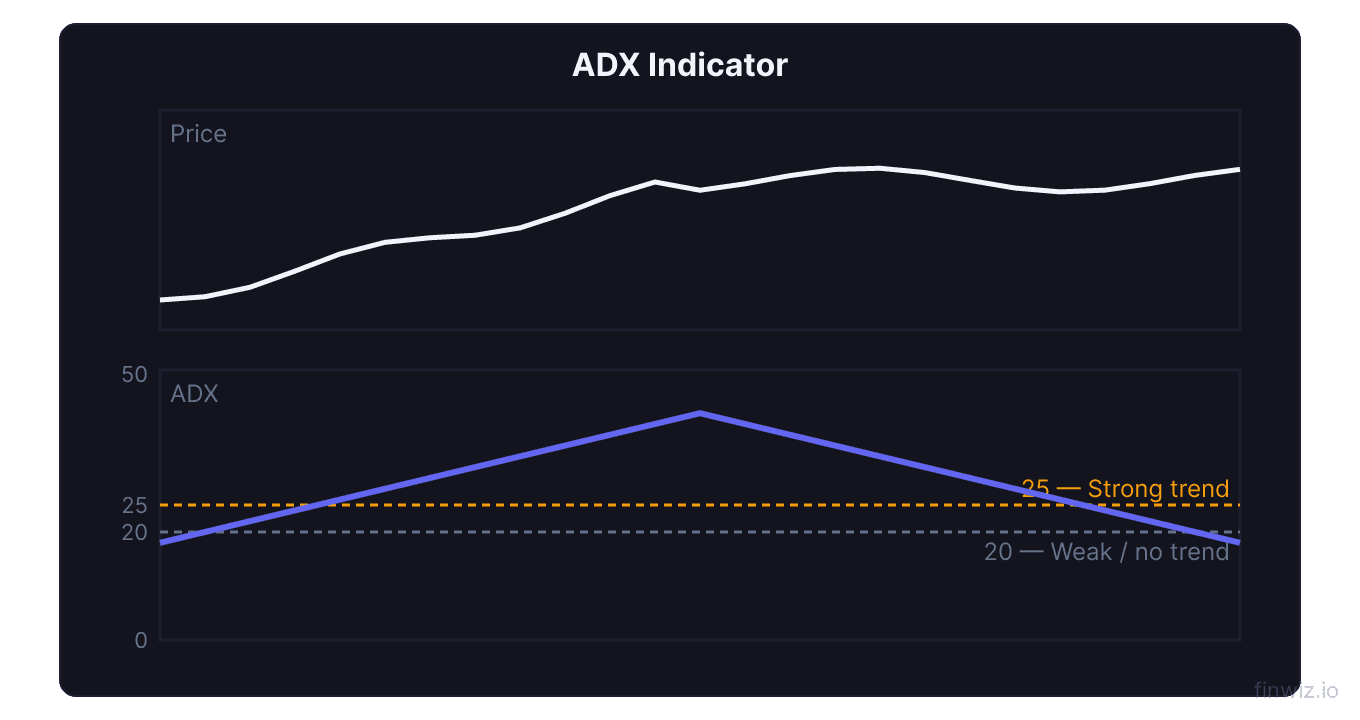
- ADX (Average Directional Index) measures trend strength on a 0-100 scale without indicating trend direction
- ADX below 25 signals a weak or absent trend (range-bound market); above 25 indicates a strong trend; above 50 signals a very strong trend
- The +DI and -DI lines determine trend direction: +DI above -DI is bullish, -DI above +DI is bearish
- ADX is most useful as a filter — helping you decide whether to use trend-following or mean-reversion strategies
- Rising ADX confirms a strengthening trend regardless of direction; falling ADX indicates the trend is weakening
What Is the ADX Indicator?
The Average Directional Index (ADX) is a technical indicator that measures the strength of a trend without indicating its direction. Developed by J. Welles Wilder Jr. and published in his 1978 book New Concepts in Technical Trading Systems, the ADX is part of the Directional Movement System, which also includes the Plus Directional Indicator (+DI) and Minus Directional Indicator (-DI).
While most indicators focus on whether price is going up or down, ADX answers a different question entirely: how strong is the current trend? This distinction is crucial because the answer determines which trading strategy to employ. In strongly trending markets, trend-following strategies with moving averages and MACD excel. In weak or trendless markets, mean-reversion strategies using RSI or Bollinger Bands are more appropriate.
ADX is displayed as a single line oscillating between 0 and 100, typically accompanied by the +DI and -DI lines. Together, these three lines provide a complete picture of both trend strength and direction.
How ADX Is Calculated
The ADX calculation involves several steps, building from directional movement to the final index value.
+DM = Current High - Previous High (if positive and greater than -DM, else 0)The Directional Movement (+DM and -DM) measures how much of today's range extends beyond yesterday's range in each direction. If today's high exceeds yesterday's high by more than yesterday's low exceeds today's low, the positive directional movement is recorded. The reverse applies for negative directional movement.
These directional movements are then divided by the ATR to normalize them for volatility, producing the +DI and -DI values. The Directional Index (DX) measures the difference between +DI and -DI as a percentage of their sum. Finally, ADX is a smoothed average of DX values, creating the stable trend strength reading.
Reading ADX Values
Interpreting ADX is straightforward once you understand the key threshold levels.
| ADX Value | Trend Strength | Trading Implication |
|---|---|---|
| 0-15 | No trend or extremely weak | Avoid trend-following strategies |
| 15-25 | Developing or weak trend | Prepare for potential trend emergence |
| 25-50 | Strong trend | Use trend-following strategies |
| 50-75 | Very strong trend | Trend is powerful but may be nearing exhaustion |
| 75-100 | Extremely strong trend | Rare — significant trend, watch for reversal |
An ADX reading below 25 is the most important threshold. It tells you that the market lacks a meaningful trend and that trend-following indicators will likely produce false signals. In this environment, oscillators and mean-reversion approaches are more effective.
An ADX reading above 25 confirms that a trend is in place and has sufficient strength to be tradeable. This is where moving average crossovers, MACD signals, and Parabolic SAR trailing stops become reliable.
Pro Tip
The +DI and -DI Lines
While ADX measures trend strength, the +DI (Plus Directional Indicator) and -DI (Minus Directional Indicator) reveal trend direction.
+DI above -DI indicates that upward directional movement is dominating — the trend is bullish. The wider the gap between +DI and -DI, the stronger the directional bias.
-DI above +DI indicates that downward directional movement is dominating — the trend is bearish. Again, the magnitude of separation matters.
DI crossovers generate trading signals. When +DI crosses above -DI, it signals a potential shift to bullish momentum. When -DI crosses above +DI, bearish momentum may be taking over. However, these crossovers should be filtered by ADX strength — only act on DI crossovers when ADX is above 20-25 to ensure the trend has substance behind it.
| Signal | Condition | Interpretation |
|---|---|---|
| Bullish | +DI crosses above -DI with ADX above 25 | Strong buy signal |
| Bearish | -DI crosses above +DI with ADX above 25 | Strong sell signal |
| Weak bullish | +DI crosses above -DI with ADX below 20 | Unreliable — wait for ADX confirmation |
| Weak bearish | -DI crosses above +DI with ADX below 20 | Unreliable — wait for ADX confirmation |
ADX Trading Strategies
Strategy 1: ADX as a Trend Filter
The most common and arguably most valuable use of ADX is as a filter for other indicators. Apply this rule to any trend-following strategy: only take signals when ADX is above 25. This single filter dramatically reduces whipsaw losses during choppy, sideways markets.
For example, if you trade MACD crossovers, only act on bullish crossovers when ADX is above 25 and +DI is above -DI. Only act on bearish crossovers when ADX is above 25 and -DI is above +DI. This filtered approach eliminates the MACD's biggest weakness — false signals in ranging markets.
Strategy 2: DI Crossover System
Enter long when +DI crosses above -DI and ADX is above 20. Enter short when -DI crosses above +DI and ADX is above 20. Use the ATR to set volatility-adjusted stop-losses. Exit when the opposite DI crossover occurs or when ADX drops below 20, indicating the trend has weakened.
Strategy 3: ADX Breakout Identification
When ADX is below 20 and beginning to rise, it often signals the start of a new trend. Watch for ADX to break above 25 and combine this with a price breakout from a consolidation range. The rising ADX confirms that the breakout has momentum behind it, reducing the chance of a false breakout.
Strategy 4: ADX for Regime Switching
Build a system that automatically switches between strategies based on ADX. When ADX is above 25, deploy trend-following tools like moving averages, MACD, and Parabolic SAR. When ADX is below 25, switch to mean-reversion tools like RSI overbought/oversold signals, Bollinger Band bounces, and stochastic oscillator crossovers. This adaptive approach performs well across all market conditions.
Pro Tip
ADX on Different Timeframes
ADX can be applied to any timeframe, and higher timeframes produce more reliable trend strength readings.
Weekly ADX identifies major trend regimes that can persist for months. When weekly ADX is above 25 with +DI above -DI, the long-term trend is strongly bullish, and you should prioritize long setups on the daily chart. Weekly ADX below 20 suggests a major consolidation phase where range trading may be more appropriate.
Daily ADX is the standard for swing traders and active investors. It identifies trends lasting days to weeks and serves as the primary ADX timeframe for most trading applications.
Intraday ADX on 15-minute or 1-hour charts can help day traders identify whether the session has a trend or is range-bound. However, intraday ADX is noisier and should be used in conjunction with VWAP and volume analysis for confirmation.
Multi-timeframe ADX analysis provides the most robust framework. If weekly ADX confirms a strong trend and daily ADX also shows trend strength, the alignment provides high confidence for trend-following trades. When the two timeframes disagree, reduce position sizes or stay on the sidelines.
ADX vs. Other Trend Indicators
Understanding how ADX compares to other trend-measuring tools helps you build a complete analytical framework.
ADX vs. Moving Averages: Moving averages show trend direction and provide dynamic support and resistance but do not quantify trend strength. ADX quantifies strength but does not provide specific price levels. The two are highly complementary — use moving averages for direction and levels, ADX for strength confirmation.
ADX vs. MACD: MACD measures momentum and provides directional signals through crossovers. ADX measures trend strength. MACD is better for timing entries and exits, while ADX is better for determining whether to trust those signals. Together they form one of the most effective indicator combinations.
ADX vs. Bollinger Band Width: Bollinger Band Width measures price volatility (standard deviation), while ADX measures directional trend strength. A market can be volatile but trendless (whipsawing up and down) — this would show wide Bollinger Bands but low ADX. Conversely, a steady, grind-higher trend might have narrow bands but high ADX.
Common ADX Mistakes
Treating ADX as a directional indicator. A common misconception is that a rising ADX means prices are going up. ADX measures trend strength in any direction. A rising ADX during a downtrend confirms that the decline is accelerating. Always check +DI and -DI for direction.
Ignoring ADX when it is low. Some traders only notice ADX when it is high. Low ADX readings are equally informative — they tell you to avoid trend-following strategies and switch to range-trading approaches. This regime identification is one of ADX's most valuable functions.
Using ADX for precise timing. ADX is a filter and confirmation tool, not a timing tool. It tells you when conditions are favorable for trending strategies, but you should use other indicators like MACD crossovers, RSI extremes, or price pattern breakouts for actual entry timing.
Applying fixed thresholds across all markets. While 25 is the standard threshold, some markets may trend at lower ADX values while others require higher readings. Observe how ADX behaves on your specific instrument and adjust thresholds if needed.
Frequently Asked Questions
What ADX reading indicates a strong trend?
An ADX reading above 25 is generally considered the threshold for a strong trend. Readings between 25 and 50 indicate a strong, tradeable trend where trend-following strategies work well. Readings above 50 indicate a very strong trend, though these extreme readings often occur near the trend's climax and may warrant tightening stops. Below 20, the market lacks a meaningful trend, and range-trading strategies are more appropriate.
How do you use ADX with MACD?
The most effective way to combine ADX and MACD is to use ADX as a filter for MACD signals. Only take MACD bullish crossovers when ADX is above 25 and rising (confirming a strong trend environment). This filter eliminates the majority of MACD whipsaw signals that occur in sideways markets. Additionally, check that +DI is above -DI for long trades and -DI is above +DI for short trades to ensure directional alignment.
Is ADX suitable for day trading?
Yes, ADX can be applied to intraday charts for day trading. Use it on 15-minute or 1-hour charts to determine whether the current session has a trending or ranging character. When intraday ADX is above 25, use momentum strategies and trend-following entries. When below 20, use mean-reversion strategies and fade extremes. Keep in mind that intraday ADX is noisier than daily ADX, so combine it with VWAP and volume analysis for better results.
What happens when ADX starts falling from a high level?
When ADX begins declining from a high level (above 40-50), it signals that the prevailing trend is losing strength. This does not necessarily mean a reversal is imminent — it often indicates a transition from trending to consolidation. Traders should begin tightening stops, taking partial profits, and avoiding new entries in the trend direction. A falling ADX combined with DI lines converging suggests the trend is exhausted and a new direction will eventually emerge.
Can ADX be used for cryptocurrency trading?
ADX works effectively on cryptocurrency markets. Due to the volatile nature of crypto, trends can develop rapidly, and ADX helps quantify whether directional momentum is truly present or if the price action is just noisy volatility. Use ADX on daily or 4-hour charts for crypto swing trading. Because crypto markets can exhibit very strong trends, you may find ADX readings above 50 more frequently than in stock markets. The same principles apply — use ADX above 25 to confirm trends and below 20 to identify range-bound conditions.
Disclaimer
This is educational content, not financial advice. Trading involves risk, and you should consult a qualified financial advisor before making any investment decisions. Past performance does not guarantee future results.
12 chapters covering charts, indicators, risk management & more. Plus weekly trading insights.