Moving Averages Explained: SMA, EMA & How to Use Them
⚡ Key Takeaways
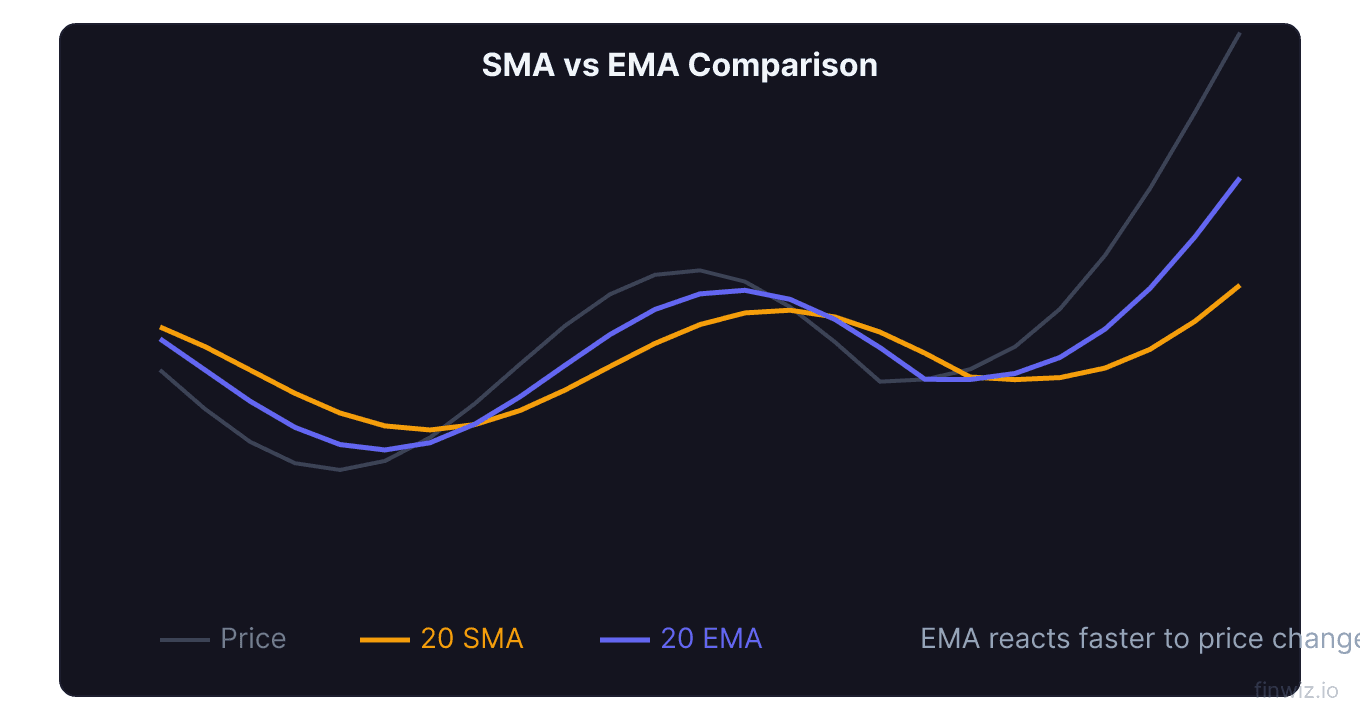
- Moving averages smooth price data to reveal trends — the SMA gives equal weight to all periods, while the EMA gives more weight to recent prices
- The Golden Cross (50 MA crossing above 200 MA) signals a bullish trend change; the Death Cross (50 below 200) signals bearish
- The 20, 50, and 200-period moving averages are the most widely watched levels and often act as dynamic support and resistance
- EMAs respond faster to price changes than SMAs, making them preferred by short-term traders for timely signals
- Moving averages are lagging indicators — they confirm trends rather than predict them, so they work best in trending markets
What Are Moving Averages?
Moving averages are among the most fundamental and widely used technical indicators in all of trading. A moving average calculates the average price of a security over a specified number of periods, creating a smooth line on the chart that filters out short-term noise and reveals the underlying trend direction.
Every professional trader, from day traders to institutional portfolio managers, uses moving averages in some capacity. They serve as dynamic support and resistance levels, trend filters, trade signals, and building blocks for more complex indicators like MACD and Bollinger Bands.
There are several types of moving averages, but the two most important are the Simple Moving Average (SMA) and the Exponential Moving Average (EMA). Understanding the differences between them and knowing when to use each is foundational knowledge for any trader.
Simple Moving Average (SMA) Explained
The Simple Moving Average (SMA) is calculated by adding up the closing prices over a specified number of periods and dividing by that number.
SMA = (P1 + P2 + P3 + ... + Pn) / nFor example, a 20-day SMA adds up the last 20 closing prices and divides by 20. Each day, the oldest price drops off and the newest price is added, causing the average to move across the chart.
The SMA treats every price in the lookback period equally. The closing price from 20 days ago carries the same weight as yesterday's close. This equal weighting makes the SMA slower to react to recent price changes, which can be either an advantage or a disadvantage depending on your trading style.
Advantages of SMA: The smoothness of the SMA reduces false signals and whipsaws. It provides a cleaner view of the trend and is less prone to premature signal changes. Long-term SMAs like the 200-day are the standard among institutional traders.
Disadvantages of SMA: The SMA lags behind current prices, especially with longer periods. It can be slow to signal trend changes, causing traders to enter late and exit late. In fast-moving markets, this lag can result in significant missed opportunities or extended losses.
Exponential Moving Average (EMA) Explained
The Exponential Moving Average (EMA) addresses the lag problem of the SMA by applying more weight to recent prices. The most recent price has the greatest influence, and the weighting decreases exponentially for older prices.
EMA = (Current Price x Multiplier) + (Previous EMA x (1 - Multiplier))For a 20-period EMA, the multiplier is 2 / 21 = 0.0952, meaning the most recent price receives about 9.52% weight in the calculation. The remaining 90.48% comes from the previous EMA, which itself was influenced by all prior prices with declining weight.
Advantages of EMA: Faster reaction to price changes means earlier signals for trend changes, entries, and exits. The EMA stays closer to current price action, making it preferred by active traders who need timely information.
Disadvantages of EMA: Greater sensitivity produces more false signals, especially in choppy markets. The EMA can whipsaw — giving a buy signal followed quickly by a sell signal — during periods of consolidation.
| Feature | SMA | EMA |
|---|---|---|
| Weighting | Equal for all periods | More weight on recent prices |
| Responsiveness | Slower | Faster |
| False signals | Fewer | More |
| Lag | More lag | Less lag |
| Best for | Identifying major trends | Timing entries and exits |
| Popular use | 200-day for institutions | 9/21 day for active traders |
Key Moving Average Periods
Not all moving average periods are equal. Certain periods have become industry standards because they are watched by millions of traders, creating self-fulfilling support and resistance levels.
The 20-Period Moving Average
The 20-period MA represents approximately one month of trading data on a daily chart. It is the most commonly used short-term moving average and serves as the basis for Bollinger Bands. Traders use it to gauge the immediate trend and as a trailing stop reference. In strong trends, price frequently bounces off the 20 MA.
The 50-Period Moving Average
The 50-period MA represents approximately one quarter of trading data. It is the primary intermediate-term trend indicator and one half of the Golden Cross and Death Cross signals. Many swing traders use the 50 MA as their primary trend filter — they only take long trades when price is above the 50 MA and short trades when below.
The 200-Period Moving Average
The 200-period moving average is the most important moving average in technical analysis. It represents approximately one year of trading data and separates bull markets from bear markets in the eyes of most institutional traders. A stock trading above its 200-day MA is considered to be in a long-term uptrend. Below it, a long-term downtrend. The 200-day SMA is watched by virtually every professional money manager on Wall Street.
Pro Tip
Golden Cross and Death Cross
The Golden Cross and Death Cross are the most famous moving average signals in all of technical analysis. They involve the interaction between the 50-period and 200-period moving averages.
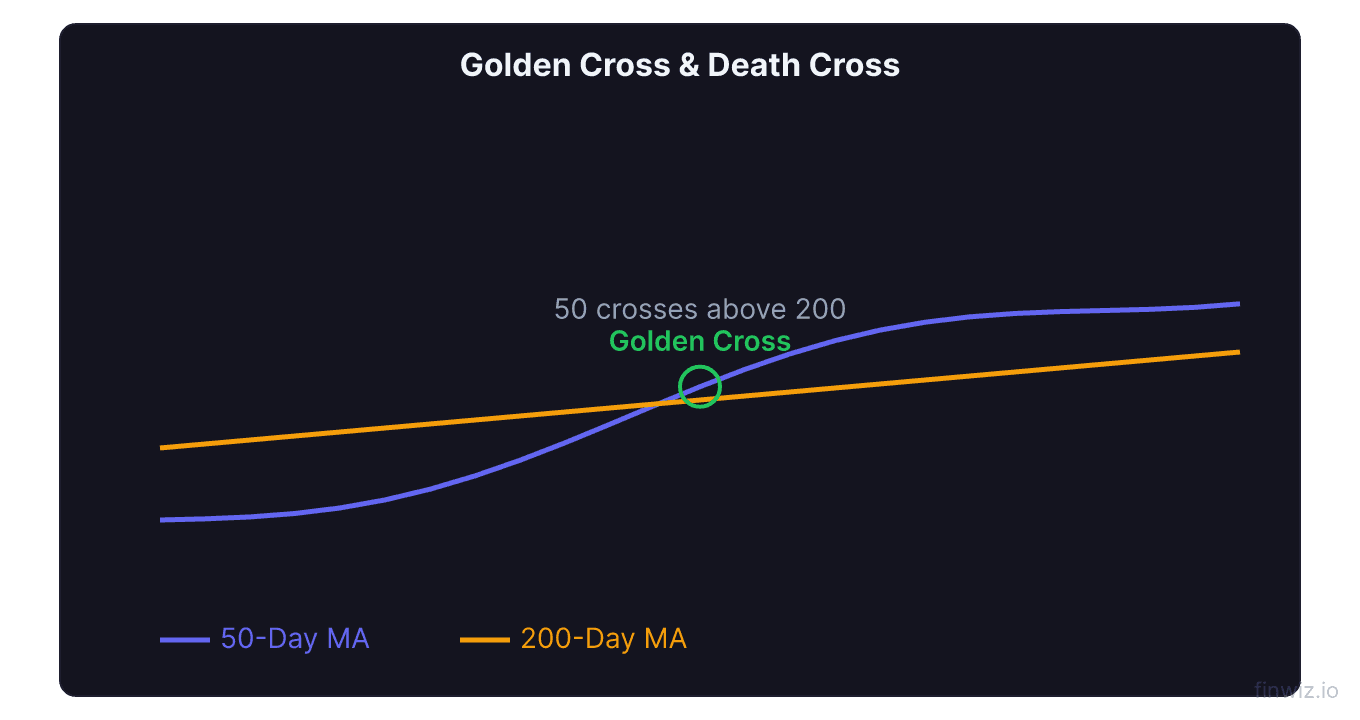
Golden Cross: Occurs when the 50-period MA crosses above the 200-period MA. This signals that the intermediate-term trend has turned bullish and is now pulling the long-term trend higher. Golden Crosses have historically preceded significant bull moves. Since 1970, the S&P 500 has averaged a gain of approximately 15% in the 12 months following a Golden Cross.
Death Cross: Occurs when the 50-period MA crosses below the 200-period MA. This signals deteriorating momentum and a potential shift from a bull market to a bear market. While Death Crosses can sometimes be false signals (especially in strong secular bull markets), they serve as a critical risk management warning.
| Signal | What Crosses | Meaning | Historical Success Rate |
|---|---|---|---|
| Golden Cross | 50 MA above 200 MA | Bullish trend change | Approximately 70% lead to sustained rallies |
| Death Cross | 50 MA below 200 MA | Bearish trend change | Approximately 60% lead to continued decline |
It is important to note that by the time a Golden Cross or Death Cross forms, a significant portion of the move has already occurred. These are trend confirmation signals, not early entry signals. Many traders use them as a filter rather than a trigger — only taking buy signals from other indicators when a Golden Cross is in effect, for example.
Moving Average Trading Strategies
Strategy 1: Trend Following with the 200 MA
The simplest and most enduring moving average strategy: buy when price is above the 200-day MA and sell or avoid when below. This single rule would have kept traders out of the worst of the 2008 financial crisis and the 2020 COVID crash while participating in the majority of bull market gains. For swing trading strategies, add the 20 EMA as an entry trigger when price pulls back within the context of the 200-day uptrend.
Strategy 2: Dual Moving Average Crossover
Use two moving averages — a fast one and a slow one. Common combinations include 9/21 EMA for day trading, 20/50 SMA for swing trading, and 50/200 SMA for position trading. Buy when the fast MA crosses above the slow MA and sell when it crosses below. This system keeps you on the right side of the trend but suffers from whipsaws in ranging markets.
Strategy 3: Moving Average Ribbon
Display multiple moving averages (such as 10, 20, 30, 40, and 50 EMA) simultaneously. When all are fanning out in order from shortest to longest, the trend is strong. When they converge and twist together, the trend is weakening or reversing. The ribbon provides a visual representation of trend strength that is difficult to replicate with any other method.
Strategy 4: Moving Average Bounce
In trending markets, wait for price to pull back to a key moving average (20, 50, or 200) and then look for a bounce. Confirm the bounce with a bullish candlestick pattern, an RSI reading coming out of oversold territory, or an increase in volume. This strategy combines the trend-following nature of moving averages with mean-reversion entry timing.
Pro Tip
Moving Averages as Dynamic Support and Resistance
One of the most practical applications of moving averages is as dynamic support and resistance levels. Unlike horizontal support and resistance from previous price levels, moving averages shift with price over time.
In an uptrend, the 20 and 50-period moving averages frequently act as support, with price bouncing off them during pullbacks. The 200-day MA serves as major support — a break below it can trigger widespread selling as algorithms and institutional strategies reference this level.
In a downtrend, the same moving averages act as resistance, capping rally attempts. A stock that rallies to its declining 50-day MA and reverses is showing that sellers are defending the intermediate-term trend.
The strength of a moving average as support or resistance depends on how widely it is watched. The 200-day SMA is the strongest because it is monitored by the largest number of market participants. When millions of traders and algorithms reference the same level, the resulting concentration of orders creates genuine supply and demand dynamics.
Moving Averages on Different Timeframes
Moving averages can be applied to any timeframe, and the choice of timeframe significantly affects the type of signals you receive.
Intraday charts (1-min to 15-min): Day traders commonly use the 9 and 20 EMA for scalping and the VWAP as their primary average. The 50 EMA on a 5-minute chart provides an intraday intermediate trend reference.
Daily charts: The standard for swing traders and active investors. The 20 SMA, 50 SMA, and 200 SMA create a complete framework for trend analysis. Most moving average studies and statistics reference daily charts.
Weekly charts: Position traders and investors use weekly moving averages for major trend analysis. The 40-week MA (equivalent to the 200-day MA) is a key level for long-term market timing. The 10-week MA (equivalent to the 50-day MA) tracks intermediate trends.
A powerful technique is multi-timeframe analysis — checking the daily moving averages for the intermediate trend and the weekly moving averages for the primary trend. When both timeframes agree (price above key MAs on both daily and weekly), the signal is substantially stronger.
Common Moving Average Mistakes
Using moving averages in ranging markets. Moving averages are trend-following tools. In sideways markets, they produce constant whipsaws — false buy and sell signals in rapid succession. Before applying a moving average strategy, confirm that the market is trending using ADX or visual analysis.
Too many moving averages. Plotting ten different moving averages on your chart creates confusion, not clarity. Stick to two or three at most: one short-term, one intermediate, and one long-term. More lines lead to analysis paralysis.
Chasing crossovers without confirmation. A moving average crossover in isolation is a weak signal. Confirm it with volume (the crossover should occur on increasing volume), momentum (MACD or RSI agreement), and ideally a breakout of a price pattern.
Ignoring the slope. The direction and angle of the moving average matter as much as the crossover. A flat moving average being crossed provides a weaker signal than a sloping one being crossed. A rising MA being crossed by price from above is less significant than a falling MA being crossed by price from below.
Frequently Asked Questions
Should I use SMA or EMA?
It depends on your trading style and timeframe. For long-term analysis (200 period), most traders use SMA because it is the industry standard and is referenced by institutional traders and algorithms. For short-term and intermediate analysis (9, 20, 50 period), many active traders prefer EMA because its faster response time produces more timely signals. A practical approach is to use SMA for the 200-period average (to align with institutional benchmarks) and EMA for shorter periods (to capture trend changes earlier).
What is the best moving average for day trading?
The 9 EMA and 20 EMA are the most popular moving averages for day trading. The 9 EMA hugs price closely and provides quick signals for scalping. The 20 EMA offers a balance between responsiveness and noise reduction. Many day traders use both together — the 9 EMA crossing the 20 EMA provides a clear entry signal. Additionally, VWAP serves as the most important intraday average since it incorporates volume weighting.
How reliable are Golden Cross signals?
Historical studies show that Golden Crosses have a success rate of approximately 70% in leading to sustained rallies over the following 6-12 months. However, the signal is lagging by nature — by the time the 50-day MA crosses the 200-day MA, the stock has typically already rallied 15-20% from its lows. The Golden Cross is best used as a trend confirmation and position management tool rather than a precise entry signal. Traders often use it as a green light to deploy more aggressive buying strategies.
Can moving averages work for cryptocurrency?
Yes, moving averages work for cryptocurrency trading, though the 24/7 nature of crypto markets means there are more data points per calendar period than stocks. The 20, 50, and 200 EMAs on daily charts are widely used in crypto markets. Because crypto tends to be more volatile than equities, some traders use slightly longer periods (like 21 and 55 instead of 20 and 50) to smooth out the additional noise. The key principles — trend identification, dynamic support and resistance, and crossover signals — apply equally to crypto and traditional markets.
How many moving averages should I use on my chart?
Use no more than three moving averages on a single chart. A good combination is a short-term (9 or 20 EMA), intermediate-term (50 SMA or EMA), and long-term (200 SMA). This gives you a complete trend picture without cluttering your chart. If you need more detail, consider using a moving average ribbon on a separate chart window rather than crowding your primary price chart. Clarity of analysis is more important than density of information.
Disclaimer
This is educational content, not financial advice. Trading involves risk, and you should consult a qualified financial advisor before making any investment decisions. Past performance does not guarantee future results.
Related Articles
12 chapters covering charts, indicators, risk management & more. Plus weekly trading insights.