Heikin Ashi Candles: Smoother Charts for Trend Trading
⚡ Key Takeaways
- Heikin-Ashi candles use a modified formula that averages price data, producing smoother charts that make trends easier to identify and follow.
- The Heikin-Ashi close is the average of open, high, low, and close; the open is the average of the prior Heikin-Ashi open and close — creating a built-in smoothing effect.
- Consecutive green Heikin-Ashi candles with no lower shadows indicate a strong uptrend, while consecutive red candles with no upper shadows signal a strong downtrend.
- Heikin-Ashi candles do NOT represent actual price levels — they are modified values, so you cannot use them for precise entry, stop, or target placement.
- Heikin-Ashi is best used for trend identification and staying in trades longer, while standard candlesticks remain necessary for exact order placement.
What Are Heikin-Ashi Candles?
Heikin-Ashi (also spelled Heiken-Ashi) is a modified candlestick charting technique that uses averaged price values to create smoother-looking charts. The name comes from the Japanese phrase meaning "average bar," which perfectly describes the technique's approach.
Unlike standard candlestick charts, which plot the actual open, high, low, and close for each period, Heikin-Ashi candles use formulas to compute modified values. The result is a chart that filters out much of the noise present in standard candlestick charts, making it easier to identify and follow trends.
Heikin-Ashi was developed as a trend-following tool. It excels at helping traders stay in profitable trends longer by reducing the number of false reversal signals that cause premature exits. However, this smoothing comes at a cost: Heikin-Ashi candles do not show actual prices, which creates limitations for precise trade execution.
The Heikin-Ashi Formula
The Heikin-Ashi system modifies all four price components of each candle. Understanding the formula reveals why these candles behave differently from standard candlesticks.
Heikin-Ashi Close = (Open + High + Low + Close) / 4Breaking Down Each Component
HA Close is the average of the four actual price values for the current period. This averaging smooths out the close price, reducing the impact of extreme intra-session moves.
HA Open is the midpoint of the previous Heikin-Ashi candle (average of prior HA Open and prior HA Close). This creates a recursive smoothing effect — each candle's open depends on the previous candle's modified values, which themselves depend on earlier modified values. This recursion is what makes Heikin-Ashi charts progressively smoother over time.
HA High is simply the highest value among the actual high, HA Open, and HA Close. This ensures the wick reflects the true session extreme.
HA Low is the lowest value among the actual low, HA Open, and HA Close. Like the high, this preserves the session's true extreme.
Pro Tip
Reading Heikin-Ashi Candles
Heikin-Ashi candles produce distinct visual signatures for different market conditions.
Strong Uptrend
During a strong uptrend, Heikin-Ashi candles appear as consecutive green candles with no lower shadows. The absence of lower shadows means the HA Low equals the HA Open — buyers are so dominant that the modified open is the session's lowest point. The longer these no-lower-shadow green candles persist, the stronger the uptrend.
Strong Downtrend
A strong downtrend produces consecutive red candles with no upper shadows. The HA High equals the HA Open, meaning sellers dominate so completely that the modified open is the session's highest price. Extended runs of these candles confirm a powerful downtrend.
Trend Weakening
When an uptrend starts weakening, Heikin-Ashi candles begin showing lower shadows on green candles. When a downtrend weakens, upper shadows appear on red candles. These shadows indicate that the opposing side is gaining traction.
Indecision / Reversal
Small-bodied candles with long shadows on both sides — similar to spinning tops or dojis — signal indecision and potential reversal. A color change (green to red or red to green) after indecision candles is a strong trend-change signal.
| Heikin-Ashi Signal | Candle Appearance | Interpretation |
|---|---|---|
| Strong uptrend | Green, no lower shadow | Stay long, trend intact |
| Weakening uptrend | Green, lower shadow appearing | Caution, tighten stops |
| Reversal zone | Small body, both shadows | Possible trend change |
| Strong downtrend | Red, no upper shadow | Stay short, trend intact |
| Weakening downtrend | Red, upper shadow appearing | Caution, potential bottom |
Trend Identification with Heikin-Ashi
The primary value of Heikin-Ashi is trend identification, and it excels in this role compared to standard candlesticks.
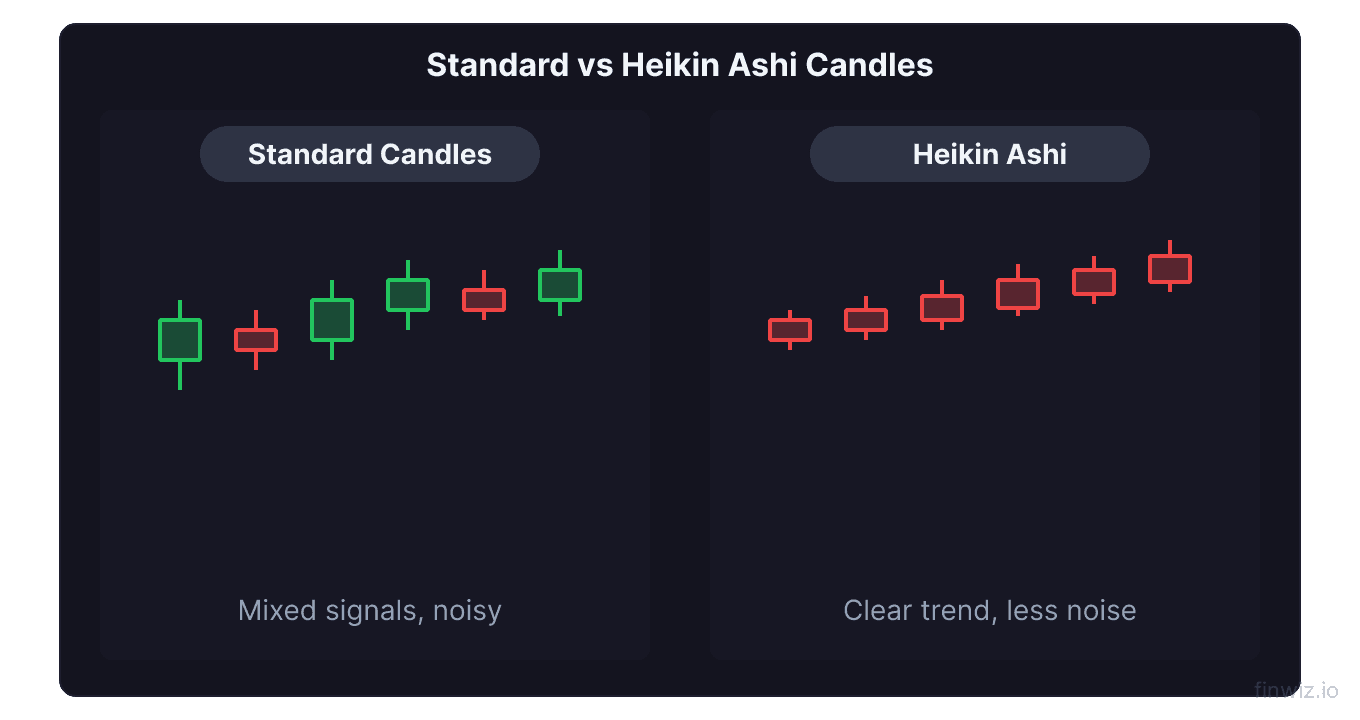
Filtering Noise
Standard candlestick charts frequently produce red (bearish) candles within uptrends and green (bullish) candles within downtrends. These counter-trend candles create noise that can cause traders to exit profitable positions prematurely or second-guess their analysis.
Heikin-Ashi's averaging formula smooths over these minor fluctuations. During an uptrend, the chart shows predominantly green candles with only occasional red candles appearing during significant pullbacks. This visual clarity helps traders stay in trends longer and avoid being shaken out by normal price fluctuations.
Trend Duration
Because Heikin-Ashi candles are smoother, the color runs (consecutive same-color candles) tend to be longer than on standard charts. A trend that might show 10 green and 4 red candles over 14 sessions on a standard chart might show 12 green and 2 red on a Heikin-Ashi chart. This makes trend duration visually clearer.
Trend Strength Assessment
The presence or absence of shadows provides a built-in trend strength indicator:
- No opposing shadow = strong trend (highest confidence)
- Small opposing shadow = moderate trend (manageable)
- Large opposing shadow = weakening trend (caution)
- Both shadows with small body = indecision (potential reversal)
Heikin-Ashi Trading Strategies
Trend Following Strategy
The most natural Heikin-Ashi strategy is trend following.
Entry: Enter long when Heikin-Ashi candles turn green after a red series (especially after doji or small-body transition candles). Enter short when candles turn red after a green series.
Stay in trade: Hold the position as long as the candles maintain their color with strong bodies and no opposing shadows.
Exit warning: Begin tightening stops when opposing shadows appear. Exit when a color change occurs or when multiple small-body indecision candles form.
Combining with Standard Candles
Many experienced traders use a dual-chart approach:
- Use Heikin-Ashi charts for trend direction and trade management decisions
- Use standard candlestick charts for precise entry and exit prices
This approach captures the best of both worlds. Heikin-Ashi keeps you focused on the trend, while standard candles provide the actual price data needed for order placement.
Combining with Indicators
Heikin-Ashi works well alongside:
- Moving averages: Use a 20-period or 50-period MA for additional trend confirmation. Enter only when Heikin-Ashi color aligns with MA direction.
- RSI: Use RSI to avoid entering Heikin-Ashi signals in overbought or oversold conditions.
- ADX: Combine ADX readings above 25 with Heikin-Ashi trend signals for high-probability trend trades.
- MACD: Use MACD crossovers to confirm Heikin-Ashi color changes.
Pro Tip
Limitations of Heikin-Ashi
Despite their usefulness, Heikin-Ashi candles have significant limitations that every trader must understand.
Not Real Prices
The most critical limitation: Heikin-Ashi values are not actual prices. The HA Open and HA Close are calculated averages, not real market prices. You cannot place a limit order at a Heikin-Ashi open or close because that price may never have actually traded.
Lagging Nature
The averaging formula introduces lag. Heikin-Ashi candles change color after the trend has already shifted, meaning you will always enter a trend late and exit late compared to standard candlestick signals. The smoother the signal, the more lag it introduces — this is an unavoidable trade-off.
Gaps Are Hidden
Heikin-Ashi candles obscure price gaps because the HA Open formula averages the prior candle's values rather than using the actual opening price. Gap analysis is important for many trading strategies, and this information is lost on Heikin-Ashi charts.
Traditional Candlestick Patterns Don't Apply
Classic candlestick patterns like engulfing patterns, hammers, and morning stars are designed for standard OHLC data. Do not apply traditional candlestick pattern analysis to Heikin-Ashi charts — the modified values distort the patterns and invalidate their statistical edge.
Whipsaws in Choppy Markets
In range-bound or choppy markets, Heikin-Ashi candles produce frequent color changes that lead to whipsaw losses. The smoothing effect helps in trending markets but provides no advantage — and may add confusion — in sideways conditions.
Heikin-Ashi vs. Standard Candlesticks vs. Renko
| Feature | Standard Candlesticks | Heikin-Ashi | Renko |
|---|---|---|---|
| Prices shown | Actual OHLC | Modified averages | Price-based bricks |
| Trend clarity | Moderate | High | Very high |
| Noise filtering | Low | Moderate | High |
| Lag | None | Moderate | Variable |
| Pattern analysis | Full support | Not applicable | Limited |
| Precise execution | Yes | No | No |
| Gap visibility | Yes | No | No |
| Time representation | Fixed intervals | Fixed intervals | Variable |
Frequently Asked Questions
Can I use Heikin-Ashi for day trading?
Yes, Heikin-Ashi works on intraday timeframes for day trading, but keep in mind the lag it introduces. For fast-moving intraday markets, the delay in color changes can result in late entries and exits. Many day traders prefer using Heikin-Ashi on a higher timeframe (like 15-minute or 1-hour) for direction while using standard candles on a lower timeframe (1-minute or 5-minute) for execution.
How do I calculate stop losses with Heikin-Ashi?
Since Heikin-Ashi values are not actual prices, you should switch to a standard candlestick chart for stop loss placement. Identify the Heikin-Ashi signal, then reference the corresponding candle on a standard chart to find the actual high, low, or close for your stop order.
Is Heikin-Ashi better than standard candlesticks?
Neither is objectively "better" — they serve different purposes. Heikin-Ashi excels at trend identification and trade management, while standard candlesticks are necessary for pattern recognition and precise order execution. Many successful traders use both together for a complete analysis framework.
Do all charting platforms support Heikin-Ashi?
Most modern charting platforms including TradingView, Thinkorswim, MetaTrader, and TrendSpider support Heikin-Ashi candles. It is typically available as a chart type option alongside standard candlesticks, bar charts, and line charts.
Can I apply technical indicators to Heikin-Ashi charts?
Yes, but be aware that indicators calculated from Heikin-Ashi data will produce slightly different values than those calculated from standard price data. This is because the HA Open and Close are modified values. Some traders prefer to overlay indicators calculated from actual price data onto a Heikin-Ashi chart for the best of both worlds.
What is the best Heikin-Ashi color-change strategy?
A simple and effective strategy is to enter on the first color change after three or more candles of the opposite color, combined with a trend filter like a 50-period moving average. For example, go long on the first green Heikin-Ashi candle after three or more consecutive red candles, but only if price is above the 50-period MA. This filters out counter-trend signals in choppy markets.
Disclaimer
This is educational content, not financial advice. Trading involves risk, and you should consult a qualified financial advisor before making any investment decisions. Past performance does not guarantee future results.
12 chapters covering charts, indicators, risk management & more. Plus weekly trading insights.