Descending Triangle Pattern: Bearish Breakdown Setup
⚡ Key Takeaways
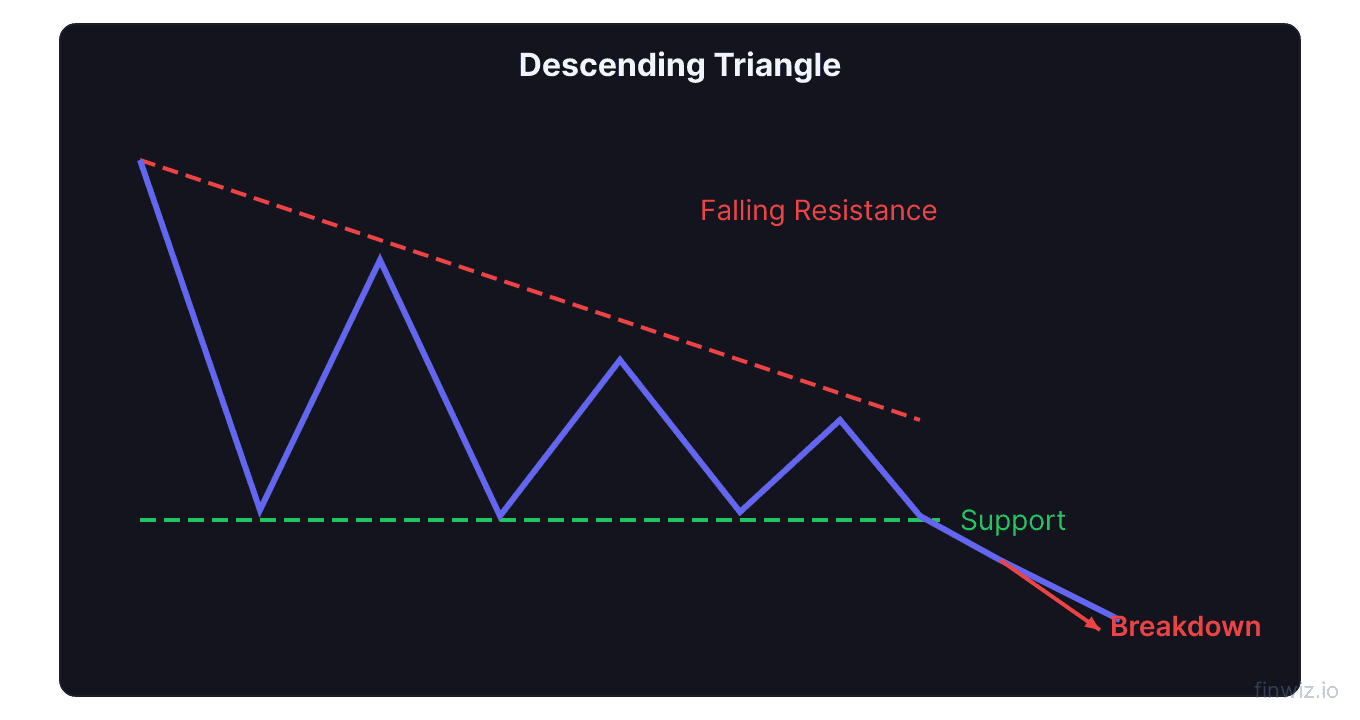
- The descending triangle is a bearish chart pattern featuring a flat horizontal support line and a descending upper trendline of lower highs.
- Each lower high shows sellers becoming more aggressive, while the repeated tests of flat support gradually weaken it until a breakdown occurs.
- Volume typically contracts during the pattern and expands on the breakdown below support, confirming the bearish move.
- The measured move target equals the height of the triangle projected downward from the breakdown point.
- While primarily bearish, the pattern can occasionally break upward, so stop losses and volume confirmation are essential.
What Is a Descending Triangle?
The descending triangle is a bearish chart pattern that forms when price consolidates between a flat horizontal support level and a descending upper trendline. Each rally produces a lower high than the previous one, while the same support level is tested repeatedly. This structure reveals increasing selling pressure against a weakening support floor.
Think of the descending triangle as the mirror image of the ascending triangle. While the ascending triangle shows buyers becoming more aggressive against fixed resistance, the descending triangle shows sellers becoming more aggressive against fixed support. The flat support line acts like a floor that is being hammered with increasing force until it finally breaks.
This pattern most commonly appears as a continuation pattern within a downtrend, confirming that the bearish trend is likely to resume after a consolidation pause. However, it can also appear near market tops as a distribution pattern, signaling the beginning of a new downtrend.
Structure of the Descending Triangle
Understanding each structural component ensures accurate pattern identification.
Flat Support Line
The flat support line is drawn across two or more approximately equal lows. Each time price declines to this level, buyers temporarily step in and push price back up. However, each subsequent bounce is weaker than the last, reflecting diminishing buying power.
For a valid descending triangle, the support level should be tested at least twice, though three or more tests create a stronger pattern. Each test absorbs more of the buying interest at that level, making the eventual breakdown more likely.
Descending Upper Trendline
The descending trendline connects the series of lower highs. Each rally attempt falls short of the previous high, demonstrating that sellers are willing to sell at progressively lower prices. This increasing eagerness to sell at lower levels reveals growing bearish conviction.
The angle of descent matters. A steeply falling trendline indicates aggressive selling and may lead to a faster breakdown. A more gradual descent suggests a slower erosion of buying power and may result in a more orderly decline after the breakdown.
The Apex
The apex is the theoretical convergence point of the two trendlines. As with other triangle patterns, the breakout should ideally occur within the final two-thirds of the triangle. Breakdowns that occur early in the pattern may be premature, while those near the apex may lack momentum.
Pro Tip
Volume Profile
Volume behavior provides critical insight into the pattern's validity and the probability of a successful breakdown.
During the formation of the descending triangle, total volume should contract. This contraction represents a tightening of the supply-demand balance as the pattern compresses. Each successive swing between the trendline and support should occur on lower volume than the previous swing.
However, within this overall contraction, a subtle difference between up-swings and down-swings can provide early clues about direction. If volume on the declines toward support is consistently higher than volume on the rallies toward the trendline, it confirms that sellers are the dominant force, strengthening the bearish bias.
On the breakdown below support, volume should expand significantly. A breakdown on heavy volume confirms that the supply that was holding at the support level has been overwhelmed and that sellers are now in control. A breakdown on weak volume should be treated with skepticism.
Trading the Descending Triangle
The pattern provides clear levels for planning entries, stops, and targets.
Entry on Breakdown
The primary entry signal comes when price closes below the flat support level on expanding volume. Wait for a confirmed close rather than acting on an intraday breach, as false breakdowns can quickly reverse.
Conservative approach: Wait for the breakdown and then look for a retest of the broken support from below (now acting as resistance). Enter short on the retest with a stop above the support-turned-resistance level. This approach offers better risk-reward but may miss breakdowns that drop sharply without retesting.
Stop Loss Placement
Place the stop loss above the most recent lower high within the triangle. This level invalidates the pattern of lower highs that defines the descending triangle. If price exceeds the last lower high, the bearish structure has broken down.
For tighter risk management, some traders place the stop just above the broken support level after the breakdown. This tighter stop reduces dollar risk but increases the probability of being stopped out by minor fluctuations.
Price Target
Price Target = Breakdown Point - Triangle HeightMeasure the height of the triangle at its widest point (from the flat support to the highest point within the pattern). Subtract that distance from the breakdown point to get the minimum expected decline.
| Aspect | Details |
|---|---|
| Signal | Bearish continuation or reversal |
| Entry | Close below flat support on volume |
| Stop Loss | Above most recent lower high |
| Target | Triangle height subtracted from breakdown |
| Volume | Contracting during formation, expanding on break |
| Reliability | ~65-70% downside resolution |
Descending Triangle vs. Falling Wedge
The descending triangle is sometimes confused with the falling wedge, but these patterns have very different implications.
A descending triangle has one flat boundary (the support line) and one descending boundary (the upper trendline). It carries a bearish bias. A falling wedge has two descending boundaries that converge, with the upper trendline declining more steeply than the lower trendline. Despite pointing downward, the falling wedge is actually a bullish pattern.
The key distinction is the support line. In a descending triangle, the flat support creates a clear level that, when broken, triggers the bearish move. In a falling wedge, the lower boundary is also declining, indicating that the pattern is compressing within an overall downward drift that typically resolves with an upside breakout.
Descending Triangle as a Reversal Pattern
While most commonly a continuation pattern within downtrends, the descending triangle can also form at market tops as a distribution pattern.
In this context, the pattern appears after a significant uptrend. The flat support represents a level that bulls are defending, while the series of lower highs shows that each rally attracts fewer buyers. When the support finally breaks, the reversal can be dramatic because it catches bullish traders off guard.
Descending triangles at tops are particularly dangerous for buy-and-hold investors who may interpret the flat support as a "floor" that will hold. The repeated tests of support weaken it, and when it breaks, the accumulated buying positions from the support tests are liquidated simultaneously, accelerating the decline.
Pro Tip
Failed Descending Triangles
Approximately 25-35% of descending triangles break upward instead of downward, producing a failed descending triangle or a bullish surprise.
An upside breakout from a descending triangle can be powerful because it traps short sellers who positioned for a breakdown. As these shorts cover their positions (buying back shares), the buying pressure can fuel a sharp rally that exceeds expectations.
Signs that a descending triangle might break upward include: RSI building bullish divergence (higher lows on RSI while price makes equal lows), volume increasing on bounces from support rather than on declines, and the broader market shifting from bearish to bullish during the pattern formation.
If you are positioned for a breakdown and price instead breaks above the descending trendline on strong volume, exit immediately. Failed patterns often produce fast, aggressive moves in the opposite direction.
Practical Trading Considerations
Several real-world factors affect how you should approach descending triangle trades.
Market context matters significantly. A descending triangle in a bear market has a higher probability of breaking down than one in a bull market. When the overall market is rising, individual stock descending triangles may fail more frequently as broad buying interest overwhelms the pattern's bearish implications.
Timeframe affects reliability. Descending triangles on daily and weekly charts are substantially more reliable than those on intraday charts. A pattern that takes weeks or months to form on the daily chart represents significant market consensus, while a pattern on a 15-minute chart may be noise.
Sector analysis provides context. If other stocks in the same sector are also forming bearish patterns, the odds of a successful breakdown increase. Conversely, if the sector is showing strength while one stock forms a descending triangle, the pattern may fail.
Earnings and events can disrupt patterns. If a descending triangle is forming ahead of an earnings report, the results can cause the pattern to resolve in either direction regardless of the technical setup. Consider reducing position size or waiting until after the event.
Short Selling Descending Triangles
For traders comfortable with short selling, the descending triangle provides an excellent framework.
Enter the short position when price closes below support on strong volume. Set the stop above the most recent lower high within the triangle. Use the measured move as your initial target, but be prepared to hold for larger gains if the broader downtrend supports further decline.
Cover partial profits at the halfway point to the measured move target. Trail the remaining position with a stop above recent swing highs as the stock declines. This allows you to lock in profits while maintaining exposure to the full move.
If you prefer not to short sell, descending triangles can also inform your decision to sell existing long positions or to avoid buying stocks that are showing this bearish formation.
Combining with Other Patterns
Descending triangles gain additional significance when they appear alongside other bearish signals.
A descending triangle that forms at the right shoulder of a head and shoulders pattern creates a powerful compound bearish setup. The head and shoulders establishes the broader reversal context, while the descending triangle provides a precise entry trigger.
If bearish candlestick patterns like the shooting star or bearish engulfing appear at the descending trendline within the triangle, they add confirmation that each rally is being met with strong selling.
Moving average death crosses (the 50-day moving average crossing below the 200-day) that occur during a descending triangle formation add yet another layer of bearish evidence, increasing the conviction for a breakdown trade.
Frequently Asked Questions
How often do descending triangles break down versus break up?
Historical analysis shows that descending triangles break downward approximately 65-70% of the time and break upward about 30-35% of the time. The actual percentages vary based on market conditions, with breakdown rates higher in bear markets and lower in bull markets. Proper volume analysis and indicator confirmation can help you identify which descending triangles are more likely to follow through on the downside breakdown. Always use a stop loss regardless of the statistical probability.
Can a descending triangle be bullish?
A descending triangle is primarily a bearish pattern, but it can sometimes break upward, producing a bullish outcome. When this happens, the move can be powerful because it traps short sellers. However, you should not enter a long position based on a descending triangle. If you want to trade a bullish triangle breakout, look for an ascending triangle or symmetrical triangle instead. If a descending triangle does break upward, you can enter long with a stop below the flat support level, but this is a secondary, lower-probability setup.
What is the minimum number of touches needed to form a valid descending triangle?
At minimum, the flat support line should be touched twice and the descending upper trendline should be touched twice. This gives you two lows at the same level and two lower highs, which is the minimum structure needed. However, patterns with three or more touches on each boundary are significantly more reliable. Each additional touch on the support line weakens it further, and each additional lower high confirms the descending trendline, making the eventual breakdown more decisive.
How do I set a stop loss if the triangle is very tall?
If the triangle's height creates a stop loss distance that is too large for your risk tolerance, you have several options. First, reduce your position size so that the dollar risk stays within your 1-2% account risk limit. Second, use a tighter stop placed just above the descending trendline instead of above the most recent lower high. Third, wait for a breakdown and retest, then use the former support level as your stop, which provides a much tighter risk point. The key is never to skip the stop loss simply because the pattern is large.
Disclaimer
This is educational content, not financial advice. Trading involves risk, and you should consult a qualified financial advisor before making any investment decisions. Past performance does not guarantee future results.
Related Articles
12 chapters covering charts, indicators, risk management & more. Plus weekly trading insights.