Bull Flag vs Bear Flag: Mirror Patterns for Opposite Trends
⚡ Key Takeaways
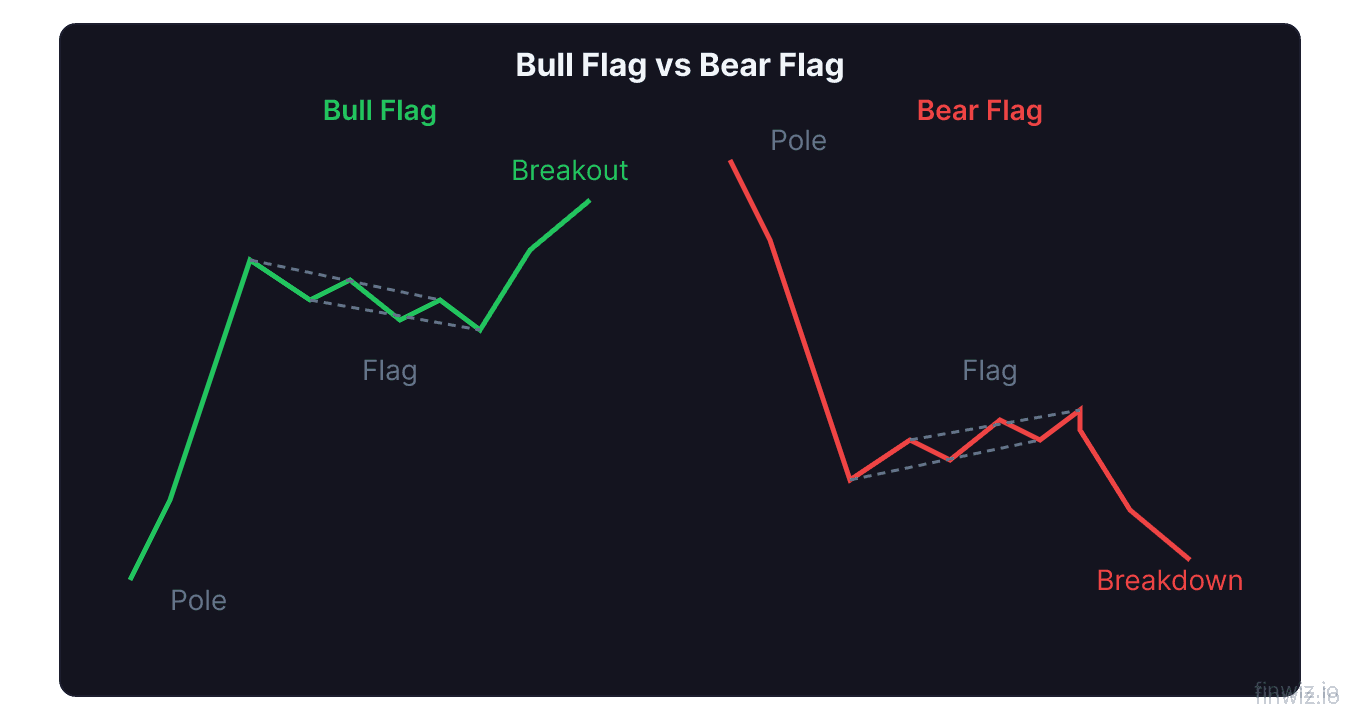
- The bull flag and bear flag are mirror-image continuation patterns — both consist of a strong directional move (the pole) followed by a consolidation channel (the flag) that slopes against the prevailing trend
- Volume should expand during the pole, contract during the flag, and surge again on the breakout or breakdown, confirming the pattern in both cases
- The price target for both patterns is calculated by measuring the pole's height and projecting it from the breakout (bull flag) or breakdown (bear flag) point
- Bull flags form in uptrends and resolve upward; bear flags form in downtrends and resolve downward — both are continuation patterns, not reversal signals
- Bear flags historically have a slightly higher failure rate than bull flags because sustained selling pressure is harder to maintain than sustained buying pressure in equity markets
Bull Flag vs Bear Flag: What Is the Difference?
The difference between a bull flag and a bear flag is the direction of the underlying trend and the expected resolution. A bull flag forms during an uptrend — a sharp rally creates the pole, followed by a slight downward-drifting consolidation (the flag) before price breaks higher. A bear flag forms during a downtrend — a sharp decline creates the pole, followed by a slight upward-drifting consolidation before price breaks lower. Both are continuation patterns, meaning they signal that the prior trend is likely to resume after a brief pause.
The two patterns are structural mirror images. Every element of the bull flag has an inverted counterpart in the bear flag: the pole direction, the flag slope, the breakout direction, the volume signature, and the target calculation. Learning one pattern effectively teaches you both. The key skill is recognizing which trend context you are in and positioning accordingly.
Anatomy of the Bull Flag
The bull flag consists of two components that reflect healthy trend dynamics in an uptrend.
The Pole (Bull Flag)
The pole is a sharp, high-volume rally that moves price significantly higher in a short period. Quality poles show strong momentum — large-bodied candles with minimal overlap, often triggered by a catalyst such as an earnings beat, sector rotation, or breakout through a key resistance level. The pole should cover at least 10-20% in a stock (proportionally less in indices or large caps). The steeper and more decisive the pole, the stronger the subsequent breakout tends to be.
The Flag (Bull Flag)
The flag is a controlled pullback that slopes slightly downward or moves sideways after the pole. It forms a channel bounded by two roughly parallel trendlines. The flag represents orderly profit-taking by short-term traders while the majority of holders maintain their positions.
Key characteristics of a quality bull flag:
- The flag retraces no more than 38-50% of the pole's advance
- Volume contracts steadily during the flag formation
- Duration is typically 5-25 trading sessions
- The channel is tight and orderly, not wide and erratic
The breakout occurs when price closes above the upper trendline of the flag channel on expanding volume. This confirms that buyers have absorbed the consolidation selling and are ready to push prices to new highs.
Anatomy of the Bear Flag
The bear flag is the inverted mirror of the bull flag, reflecting trend dynamics in a downtrend.
The Pole (Bear Flag)
The pole is a sharp, high-volume decline. It represents aggressive selling pressure — large red candles, gap-downs, and heavy volume driven by negative catalysts such as earnings misses, guidance cuts, or sector-wide selling. The pole should be steep and cover significant ground quickly.
The Flag (Bear Flag)
The flag is a weak bounce that slopes slightly upward or moves sideways. It represents short-covering and tentative buying that lacks the conviction to reverse the downtrend. The flag forms an ascending channel bounded by two roughly parallel trendlines.
Key characteristics of a quality bear flag:
- The flag retraces no more than 38-50% of the pole's decline
- Volume is low and declining during the flag — the bounce lacks participation
- Duration mirrors the bull flag at roughly 5-25 sessions
- The channel is compact, showing a half-hearted recovery
The breakdown occurs when price closes below the lower trendline of the flag on expanding volume. This confirms that the brief respite is over and sellers are regaining control.
Pro Tip
Bull Flag vs Bear Flag: Side-by-Side Comparison
| Feature | Bull Flag | Bear Flag |
|---|---|---|
| Trend context | Uptrend | Downtrend |
| Pole direction | Sharp rally upward | Sharp decline downward |
| Flag slope | Slightly downward (against trend) | Slightly upward (against trend) |
| Flag meaning | Orderly profit-taking | Weak short-covering bounce |
| Trigger | Break above upper flag trendline | Break below lower flag trendline |
| Volume on breakout | Expanding (confirmation) | Expanding (confirmation) |
| Target calculation | Pole height added to breakout point | Pole height subtracted from breakdown point |
| Ideal retracement | 20-38% of pole | 20-38% of pole |
| Typical duration | 1-4 weeks | 1-4 weeks |
| Failure mode | Price breaks below flag support | Price breaks above flag resistance |
Volume: The Confirmation Signal
Volume patterns are critical for validating both bull flags and bear flags. The volume signature follows the same three-phase sequence in both patterns — the direction differs, but the rhythm is identical.
Phase 1: Pole formation. Volume surges as the strong directional move unfolds. In a bull flag, this is buying volume driving the rally. In a bear flag, this is selling volume driving the decline. High volume during the pole confirms institutional participation and conviction behind the move.
Phase 2: Flag consolidation. Volume contracts as the countertrend drift unfolds. Declining volume during the flag is one of the most important confirmation signals. It shows that the countertrend move lacks participation — the pause is driven by a small number of traders, not a shift in the dominant trend.
Phase 3: Breakout or breakdown. Volume expands sharply as price resolves in the direction of the prior trend. A breakout (bull flag) or breakdown (bear flag) without volume expansion is suspect. Low-volume breakouts are more likely to fail, trapping traders in false moves.
Pro Tip
Price Target Calculation
Both bull flags and bear flags use the same target methodology: measure the pole's height and project it from the breakout or breakdown point.
Bull Flag Target
Bull Flag Target = Breakout Price + (Top of Pole - Bottom of Pole)Example: A stock rallies from $50 to $70 (pole height = $20), then consolidates in a flag between $65 and $68. It breaks out above $68. The measured move target is $68 + $20 = $88.
Bear Flag Target
Bear Flag Target = Breakdown Price - (Top of Pole - Bottom of Pole)Example: A stock drops from $100 to $75 (pole height = $25), then bounces in a flag between $78 and $82. It breaks down below $78. The measured move target is $78 - $25 = $53.
These are measured move targets, not guarantees. Price may exceed the target in strong trends or fall short in weaker conditions. Many traders use the measured move as a minimum profit objective and trail a stop to capture additional upside if momentum continues.
Entry, Stop Loss, and Risk Management
Disciplined entries and stop placement are essential for trading both patterns effectively.
Bull Flag Entry Rules
Entry: Buy on a close above the upper trendline of the flag channel, or on the first candle that clears the flag high with above-average volume.
Stop loss: Place the stop below the lowest point of the flag. If the flag's low is $64 and you enter at $68, your risk is $4 per share.
Risk-reward: With a $4 risk and a $20 measured move target, the risk-reward ratio is 1:5 — well above the 1:2 minimum most traders seek.
Bear Flag Entry Rules
Entry: Short on a close below the lower trendline of the flag channel, or on the first candle that breaks the flag low with above-average volume. This requires a margin account for short selling.
Stop loss: Place the stop above the highest point of the flag. If the flag's high is $82 and you enter short at $78, your risk is $4 per share.
Risk-reward: With a $4 risk and a $25 measured move target, the risk-reward ratio is 1:6.25.
Failure Rates and False Breakouts
Not all flags resolve as expected. Understanding failure characteristics helps you cut losses quickly when a pattern does not work.
Bull flag failures occur when price breaks below the lower trendline of the flag instead of breaking above the upper trendline. A close below the flag's low invalidates the pattern and suggests the prior uptrend may be reversing. Bull flag failures can lead to sharp declines as trapped bulls liquidate positions.
Bear flag failures occur when price breaks above the upper trendline of the flag. This is sometimes called a "failed breakdown" and can signal that the downtrend is losing momentum. Bear flag failures can produce violent short squeezes as trapped shorts are forced to cover.
In equity markets, bear flags tend to fail slightly more often than bull flags. This asymmetry exists because stocks have a natural upward bias over time — sustained selling pressure requires continuous negative catalysts, while buying pressure is supported by economic growth, earnings expansion, and investor inflows. This does not mean bear flags are unreliable, but traders should demand stronger confirmation before entering bear flag shorts.
Traders who focus on breakout trading strategies often predefine their invalidation level before entering, ensuring that a pattern failure results in a controlled loss rather than an emotional reaction.
Flags vs Other Continuation Patterns
Bull and bear flags are part of a broader family of continuation patterns. Understanding how they compare to similar patterns prevents misidentification.
Flags vs pennants: Pennants are symmetrical triangles that form after a pole, with converging trendlines rather than the parallel trendlines of a flag. Pennants signal the same continuation but with a tightening range that creates a distinct wedge shape. Flags drift against the trend; pennants compress symmetrically.
Flags vs wedges: Rising and falling wedges can be continuation or reversal patterns depending on context. Flags always slope against the prior trend and are always continuation patterns. Wedges have converging trendlines and can appear in various trend positions.
Flags vs rectangles: Rectangular consolidations (flat-top or flat-bottom ranges) are horizontal, while flags slope against the trend. Rectangles take longer to form and do not have the distinct pole component that defines flag patterns.
The pole is what distinguishes flags from all other consolidation patterns. Without a preceding sharp, high-volume directional move, the consolidation that follows is simply a range — not a flag.
Frequently Asked Questions
Can a bull flag turn into a bear flag?
No. A bull flag and a bear flag require opposite trend contexts. A bull flag forms after a sharp rally in an uptrend. If that pattern fails and price breaks below the flag, it becomes a failed bull flag, not a bear flag. A bear flag requires its own separate sharp decline (pole) followed by a weak bounce (flag). Each pattern has distinct formation requirements that prevent one from morphing into the other.
Which is more reliable, bull flags or bear flags?
Bull flags tend to be slightly more reliable in equity markets because stocks have a long-term upward bias. Continuation patterns in the direction of the prevailing market trend (upward for stocks) benefit from the natural tailwind of economic growth and earnings expansion. Bear flags work well in confirmed downtrends and bear markets but have a modestly higher failure rate during sideways or ambiguous market conditions.
How long should I wait for a flag to break out?
Most flags resolve within 1-4 weeks (5-25 trading sessions). Flags that extend beyond four weeks risk losing the momentum generated by the pole. If a flag has not resolved after approximately 20-25 sessions, the pattern weakens and the probability of a clean breakout diminishes. Many traders set a time stop — if the pattern has not triggered within their expected window, they remove it from their watchlist and move on.
Do bull flags and bear flags work on intraday charts?
Yes, both patterns appear on all timeframes, from 1-minute charts used by scalpers to weekly charts used by position traders. Intraday flags tend to have shorter flag durations (minutes to hours) and smaller measured move targets. The volume confirmation principles remain the same regardless of timeframe, though intraday volume data can be noisier and harder to interpret cleanly.
12 chapters covering charts, indicators, risk management & more. Plus weekly trading insights.