Inside Bar Pattern: Low-Risk Breakout Entry Strategy
⚡ Key Takeaways
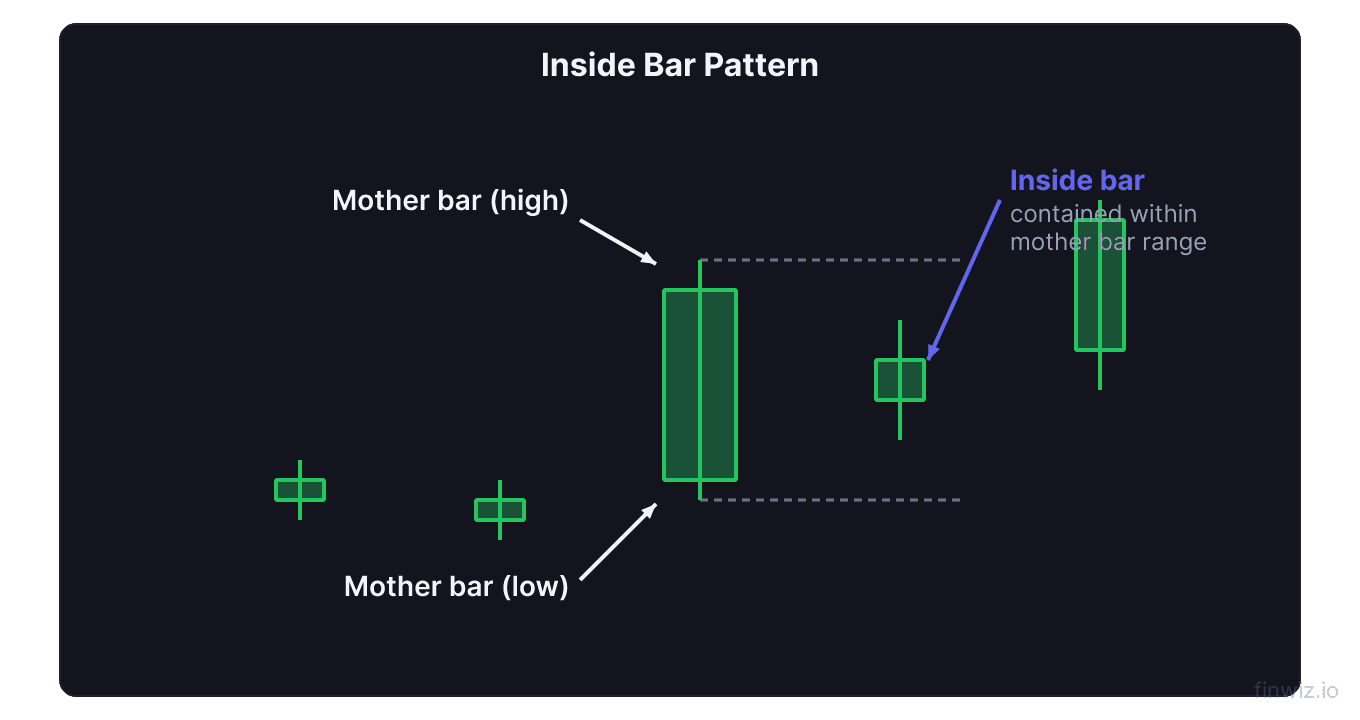
- An inside bar is a candlestick pattern where the current bar's high and low are completely contained within the prior bar's range — the prior bar is called the mother bar
- Inside bars represent consolidation and compression — a tightening of price range that often precedes a significant breakout in either direction
- The breakout trade enters when price breaks above the inside bar's high (bullish) or below its low (bearish), with a stop-loss on the opposite side of the inside bar
- Inside bars are most reliable on daily and 4-hour charts — lower timeframes produce too many false signals due to intraday noise
- Multiple consecutive inside bars (inside-inside bars or "coils") create even tighter compression and typically produce more powerful breakouts
What Is an Inside Bar?
An inside bar is a two-candle chart pattern where the second candle's entire price range (from high to low) falls within the range of the preceding candle. The first, larger candle is called the mother bar, and the smaller candle contained within it is the inside bar. The pattern signals that the market has entered a period of consolidation, with neither buyers nor sellers able to push price beyond the prior period's range.
Inside bars appear frequently on all timeframes and in all markets. They are one of the most popular price action setups because they provide clearly defined entry levels, logical stop-loss placement, and favorable risk-to-reward ratios. The pattern works because compression of price range builds energy that is released when the range breaks.
Think of an inside bar as a coiled spring. The mother bar establishes the range, and the inside bar shows that the market is tightening within that range — compressing. When the spring releases (price breaks above or below the inside bar), the resulting move often carries significant momentum.
Identifying Inside Bars
The identification rules for inside bars are precise and leave no ambiguity.
Inside Bar Rules:Some traders include the candle bodies (open and close) in the analysis, but the traditional definition uses only the highs and lows (the full range including wicks). The color of the inside bar (green/bullish or red/bearish) is secondary to the containment pattern itself.
What the inside bar tells you:
- Indecision: Neither buyers nor sellers had enough conviction to push beyond the prior bar's range
- Digestion: The market is processing a prior move before deciding on the next direction
- Volatility contraction: ATR (Average True Range) is declining, suggesting a breakout is approaching — volatility tends to cycle between expansion and contraction
Inside Bar as a Breakout Setup
The most common use of the inside bar is as a breakout trade — entering a position when price breaks above the inside bar's high (long entry) or below its low (short entry).
Bullish Inside Bar Breakout
A bullish inside bar breakout occurs when the price breaks above the inside bar's high (or the mother bar's high for a more conservative entry). This setup is most effective when:
- The inside bar forms during an existing uptrend (continuation pattern)
- The inside bar appears at a support level during a pullback
- The mother bar is bullish (green body) with the inside bar also bullish
- Volume declines on the inside bar and expands on the breakout
Entry: Buy when price breaks above the inside bar's high by a small margin ($0.05-$0.10 for stocks under $50, or a few ticks for higher-priced names)
Stop-loss: Below the inside bar's low (aggressive) or below the mother bar's low (conservative)
Target: A measured move equal to the mother bar's range, projected from the breakout level, or the next significant resistance level
Bearish Inside Bar Breakout
A bearish inside bar breakout occurs when the price breaks below the inside bar's low. This setup works best when:
- The inside bar forms during an existing downtrend (continuation)
- It appears at a resistance level during a bounce
- The mother bar is bearish (red body)
- Context supports downside (declining moving averages, negative market breadth)
Entry: Sell/short when price breaks below the inside bar's low
Stop-loss: Above the inside bar's high (aggressive) or above the mother bar's high (conservative)
Target: Measured move or next support level
Pro Tip
The conservative approach uses the mother bar's high/low for entries and stops, while the aggressive approach uses the inside bar's high/low. The aggressive approach provides tighter stops and better risk-to-reward but more false breakouts. The conservative approach has fewer false signals but wider stops. Match the approach to your trading style and the current market conditions — use aggressive entries in strong trends and conservative entries in choppy markets.
Inside Bars on Daily and 4-Hour Charts
Inside bars form on every timeframe, but their reliability varies dramatically based on the chart period.
Daily Chart Inside Bars (Most Reliable)
On daily charts, each candle represents a full day of trading with millions of participants. When an entire day's range falls within the prior day's range, it represents a genuinely significant compression of activity. Daily inside bars are the gold standard for this pattern.
Daily inside bars often set up multi-day breakout trades with potential for 2-5% or more in profits. They are favored by swing traders who hold positions for days to weeks.
4-Hour Chart Inside Bars (Very Reliable)
4-hour inside bars provide a good balance between signal quality and frequency. They are especially useful for forex and futures traders where 24-hour markets make daily bars less clean. For stock traders, 4-hour inside bars can identify intraday setups with follow-through potential over 1-3 days.
Hourly and Below (Less Reliable)
Inside bars on 1-hour, 15-minute, or 5-minute charts are common but produce significantly more false breakouts. The noise level on lower timeframes means that price frequently breaks above or below inside bars only to reverse immediately. If you trade lower-timeframe inside bars, use additional confirmation (volume surge, alignment with a higher-timeframe trend, indicator confirmation) and expect a lower win rate.
Inside Bar Reliability by Timeframe (approximate):Multiple Inside Bars: The Coiling Pattern
When two or more consecutive inside bars form — each contained within the mother bar's range — the pattern becomes even more powerful. This formation is sometimes called an inside-inside bar (for two inside bars) or a coiling pattern (for three or more).
Multiple inside bars represent extreme compression of price range. Like a spring being compressed further and further, the buildup of potential energy increases with each additional inside bar. When the breakout finally occurs, it often produces a move more powerful than a single inside bar breakout.
Identification: The key requirement is that ALL inside bars must be contained within the original mother bar's range. If any subsequent bar exceeds the mother bar's high or low, the pattern is broken.
Trading multiple inside bars:
- Wait for all inside bars to complete (do not trade intermediate breaks within the pattern)
- Enter on a break above the mother bar's high (bullish) or below its low (bearish)
- Stop on the opposite side of the mother bar
- The tight compression creates an excellent risk-to-reward ratio because the stop is relatively close while the expected move is amplified
Three or more inside bars within a single mother bar is a relatively rare formation that attracts attention from experienced price action traders. When it appears at a key level on a daily chart, it is one of the highest-probability setups in technical analysis.
Inside Bars in Trending vs. Ranging Markets
The context in which an inside bar appears dramatically affects its reliability and how you should trade it.
Inside Bars in Trending Markets (Continuation)
In a strong trend, inside bars typically serve as continuation patterns — brief pauses before the trend resumes. The trend direction provides the bias: in an uptrend, expect the breakout to resolve upward; in a downtrend, expect the breakout to resolve downward.
Trading with the trend means you can be directionally biased — only taking breakouts in the trend's direction and ignoring breakouts against it. This improves the win rate significantly compared to trading both sides.
Inside Bars at Key Levels (Reversal)
When an inside bar forms at a major support or resistance level, it can signal a potential reversal. The inside bar represents the market pausing at a decision point, and the subsequent breakout indicates which side won.
An inside bar at the 200-day moving average, at a monthly support/resistance level, or at a major Fibonacci level carries more weight than one forming at a random location on the chart.
Inside Bars in Choppy Markets (Avoid)
In sideways, choppy markets with no clear trend, inside bars frequently produce false breakouts in both directions. The lack of a directional bias means the breakout is essentially a coin flip, and the subsequent reversal often stops you out quickly. Experienced traders avoid inside bar trades during choppy conditions and wait for trending environments.
Pro Tip
Use the ADX indicator (Average Directional Index) to filter inside bar trades. When ADX is above 20-25, the market has sufficient trend strength for inside bar breakouts to follow through. When ADX is below 20, the market is ranging and inside bars are less reliable. This simple filter can significantly improve your win rate.
Combining Inside Bars With Other Analysis
Inside bars are most powerful when combined with other forms of analysis for confluence — multiple signals pointing in the same direction.
Inside Bar + Support/Resistance
A bullish inside bar forming directly at a known support level combines two independent reasons to buy. The support level suggests demand exists, and the inside bar provides a precise entry mechanism with a defined stop.
Inside Bar + Moving Average
An inside bar forming at a key moving average (20-day, 50-day, or 200-day) during a trend creates a high-probability setup. In an uptrend, an inside bar at the rising 20-day EMA is a classic pullback entry.
Inside Bar + Volume Analysis
Declining volume on the inside bar followed by a volume surge on the breakout confirms that the compression was genuine and the breakout has participation. Without the volume surge, the breakout may fail.
Inside Bar + Trend Lines
An inside bar forming at a rising trend line in an uptrend or a declining trend line in a downtrend creates a natural entry point where the trend and the pattern align.
Common Inside Bar Mistakes
Trading every inside bar: Inside bars are common, especially on lower timeframes. Trading all of them without context leads to overtrading and death by a thousand cuts. Be selective — only trade inside bars with clear trend context, key level confluence, or multiple inside bar compression.
Using stops that are too tight: Placing stops just inside the mother bar (rather than beyond it) leads to premature stop-outs from normal noise. Give the trade room by placing stops beyond the mother bar's extreme.
Ignoring the trend: Taking bearish inside bar breakouts in a strong uptrend or bullish breakouts in a strong downtrend puts you against the dominant force. Always consider the higher timeframe trend before taking a breakout trade.
Forgetting to manage the trade: After entering on a breakout, trail your stop-loss as the trade moves in your favor. Move the stop to breakeven after the trade moves one risk unit in your favor, then trail behind swing lows (for long trades) or swing highs (for shorts).
Frequently Asked Questions
How is an inside bar different from a harami pattern?
The harami pattern is the candlestick name for what is essentially the same concept — a smaller candle contained within the prior candle's range. The main difference is that the traditional harami definition uses the candle bodies (open and close) rather than the highs and lows (full range including wicks). In practice, many traders use the terms interchangeably, but inside bars technically refer to the full range (including wicks) being contained.
Can inside bars predict the direction of the breakout?
Not with certainty. Inside bars signal that a breakout is coming but do not reliably predict which direction. However, the trend context provides a strong bias. In an uptrend, approximately 60-65% of inside bar breakouts resolve upward (continuation). In a downtrend, a similar percentage resolves downward. Trading with the trend and taking only directional breakouts improves probability significantly.
How many inside bars is too many?
There is no strict limit, but four or more consecutive inside bars within a single mother bar is extremely rare and creates an exceptionally tight coil. In practice, most trades are based on 1-3 inside bars. If the coiling persists beyond 5 bars without a breakout, the pattern may be losing its energy as the consolidation becomes a new range rather than a compression pattern.
Do inside bars work in crypto and forex markets?
Yes. Inside bars are effective in any market that can be charted with candlesticks. They are particularly popular in forex trading where daily and 4-hour inside bars are standard setups. In 24-hour markets like forex and crypto, the lack of overnight gaps means inside bars represent pure price compression without the influence of gap dynamics.
What is the best risk-to-reward ratio for inside bar trades?
Aim for a minimum 1:1.5 risk-to-reward ratio and preferably 1:2 or better. The inside bar's structure naturally supports good ratios because the stop (opposite side of the inside bar) is relatively tight while breakout moves often extend well beyond the mother bar's range. Multiple inside bar setups offer even better ratios because the compression produces a tighter stop relative to the expected breakout move.
Disclaimer
This is educational content, not financial advice. Trading involves risk, and you should consult a qualified financial advisor before making any investment decisions. Past performance does not guarantee future results.
Related Articles
12 chapters covering charts, indicators, risk management & more. Plus weekly trading insights.