Triple Top & Triple Bottom: Extended Reversal Patterns
⚡ Key Takeaways
- The triple top is a bearish reversal pattern where price tests a resistance level three times and fails to break through, signaling exhaustion of buying pressure.
- The triple bottom is a bullish reversal pattern where price tests a support level three times and fails to break down, signaling exhaustion of selling pressure.
- Both patterns confirm only when price breaks through the neckline (support for triple top, resistance for triple bottom) on increased volume.
- Triple tops and bottoms take longer to form than double tops/bottoms, but the extra test makes the eventual breakout more reliable.
- Volume typically declines with each successive test of the level, reflecting diminishing conviction, then surges on the breakout candle.
What Is a Triple Top?
The triple top is a bearish reversal pattern that forms when price reaches a resistance level three times and fails to break through. After three failed attempts to push higher, the buying pressure is exhausted, and price typically breaks down through the support level (neckline) that connects the troughs between the peaks.
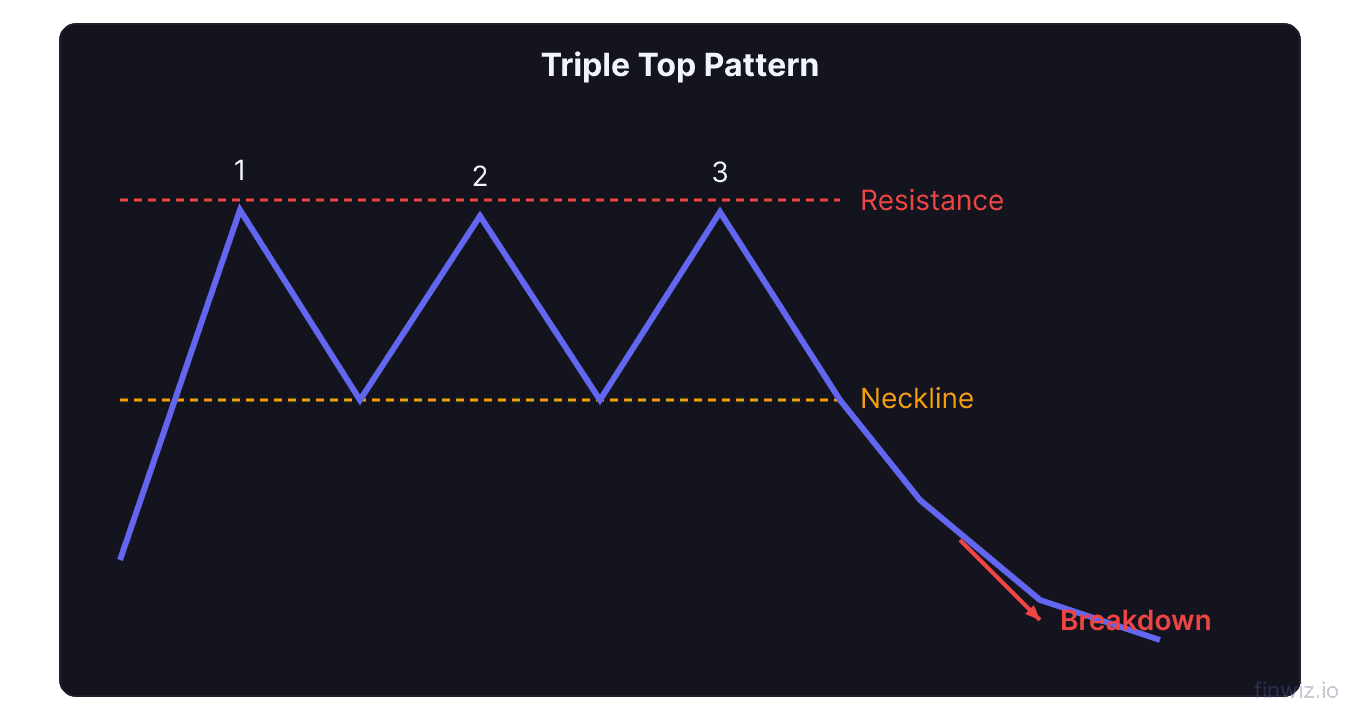
This pattern appears at the end of uptrends and signals that the bulls have repeatedly tried to push to new highs but have been rebuffed each time. Three failures at the same level represent a powerful statement: the market has decisively rejected those prices.
The triple top is an extended version of the double top, and the additional test adds a layer of confirmation that makes the eventual breakdown more reliable. However, the pattern takes longer to develop, requiring patience from traders who spot it early.
What Is a Triple Bottom?
The triple bottom is a bullish reversal pattern where price tests a support level three times and bounces each time. After three failed attempts to push lower, selling pressure is exhausted, and price breaks up through the resistance level (neckline) connecting the peaks between the troughs.
This pattern appears at the end of downtrends and signals that sellers have repeatedly tried to drive prices to new lows without success. Three successful defenses of a support level demonstrate strong buying interest at that price.
The triple bottom is the mirror image of the triple top and is an extended version of the double bottom.
Triple Top Structure in Detail
Understanding the precise anatomy of the triple top helps you identify it early and plan your trade.
Three Peaks
The three peaks should reach approximately the same price level. They do not need to be identical — a tolerance of 1-3% is acceptable. The peaks represent three separate attempts by buyers to push through resistance, each of which fails.
Two Troughs (Neckline)
The two troughs between the peaks create the neckline — a horizontal or slightly sloping support line. This neckline is the critical level that must break for the pattern to confirm.
Volume Profile
Volume behavior across the three peaks reveals the pattern's internal dynamics:
| Peak | Expected Volume | Interpretation |
|---|---|---|
| First peak | Highest | Strong buying attempt at resistance |
| Second peak | Lower than first | Diminishing buying conviction |
| Third peak | Lowest of the three | Exhaustion — buyers running out of fuel |
| Neckline break | Surge | Confirmation of breakdown |
This declining volume across successive peaks is one of the pattern's most important validation criteria. If volume increases on the third peak, the resistance level may actually be weakening, and a breakout (rather than reversal) could occur.
Pro Tip
Triple Bottom Structure in Detail
Three Troughs
The three troughs reach approximately the same support level, each representing a failed attempt by sellers to push prices to new lows. Like the triple top, a tolerance of 1-3% between lows is acceptable.
Two Peaks (Neckline)
The two rally peaks between the troughs create the neckline resistance. A breakout above this neckline confirms the pattern.
Volume Profile
The ideal triple bottom shows declining volume on each successive trough test and a volume surge on the neckline breakout. This declining volume shows that fewer sellers are willing to push prices to the support level, while the breakout volume confirms that buyers have taken control.
Trading the Triple Top
Entry
The most reliable entry is a short position on the neckline break. Wait for a candle to close below the neckline, confirming the breakdown. Aggressive traders may enter as price breaks through the neckline intraday, but the close below provides more reliable confirmation.
An alternative entry is to wait for a retest of the broken neckline from below. After breaking down, price frequently pulls back to the neckline (which now acts as resistance) before continuing lower. This retest entry provides a better risk-reward ratio.
Stop Loss
Place the stop above the highest peak of the three. This is the level where the entire pattern would be invalidated. For tighter risk management, some traders place the stop above the third peak only, accepting slightly less protection.
Profit Target
The classic target uses the measured move method:
Triple Top Target = Neckline Level - (Peak Level - Neckline Level)This measured move projects the pattern's height below the neckline, providing a minimum expected move.
Trading the Triple Bottom
Entry
Enter a long position on the neckline breakout — a close above the neckline resistance confirms the pattern. The retest entry (buying when price pulls back to the broken neckline, which now acts as support) offers a better risk-reward setup.
Stop Loss
Place the stop below the lowest trough of the three. If price returns to this level, the bullish reversal thesis has failed.
Profit Target
Triple Bottom Target = Neckline Level + (Neckline Level - Trough Level)Triple Top/Bottom vs. Double Top/Bottom
Understanding how these related patterns differ helps you trade each appropriately.
| Feature | Double Top/Bottom | Triple Top/Bottom |
|---|---|---|
| Number of tests | Two | Three |
| Formation time | Shorter | Longer |
| Signal reliability | Good | Stronger |
| Breakout strength | Moderate | Often stronger |
| Frequency | More common | Less common |
| Volume pattern | Declining on second test | Declining across three tests |
| Patience required | Moderate | High |
The third test in a triple pattern provides additional confirmation that the level is significant. However, a potential downside is that by the time three tests complete, many traders have already recognized the pattern, potentially reducing the edge.
Pro Tip
Volume Confirmation Is Essential
Volume is the single most important confirmation tool for triple tops and bottoms.
Volume Decline Across Tests
As described above, volume should decline with each successive test of the support/resistance level. This declining volume tells you that participation in each test is diminishing — fewer traders are willing to push price toward the level.
For the triple top, declining volume on peaks means fewer buyers at resistance. For the triple bottom, declining volume on troughs means fewer sellers at support.
Volume Surge on Breakout
The breakout candle (the close through the neckline) should occur on above-average volume. This surge confirms that the breakout has broad participation and is not a false signal.
A breakout on low volume is suspicious and more likely to fail. Wait for volume confirmation before committing capital. Monitor On-Balance Volume for additional volume trend analysis.
Using Volume Indicators
- OBV: Should show a divergence from price during pattern formation (price makes equal highs/lows, but OBV trends against the price pattern)
- Accumulation/Distribution: Should trend in the breakout direction before the actual breakout occurs
- Volume Profile: High-volume nodes near the neckline increase the significance of the breakout level
Triple Top/Bottom in Context
Best Conditions
Triple tops work best when:
- They form after extended uptrends with overbought momentum indicators
- The peaks align with a historical resistance level or round number
- RSI shows bearish divergence (lower RSI readings at each peak)
- The overall market environment is showing weakness
Triple bottoms work best when:
- They form after extended downtrends with oversold conditions
- The troughs align with historical support, moving averages, or Fibonacci levels
- RSI shows bullish divergence (higher RSI readings at each trough)
- Broader market conditions are stabilizing or turning positive
False Breakouts
False breakouts are a risk with all pattern-based trading. A false breakdown below a triple bottom's support or a false breakout above a triple top's resistance can trap traders on the wrong side.
To reduce false breakout risk:
- Wait for a closing candle beyond the neckline, not just an intraday touch
- Require volume confirmation on the breakout candle
- Use a percentage filter — require price to move 1-2% beyond the neckline before confirming
- Watch for a retest of the neckline before entering
Combining with Technical Indicators
Moving averages. A triple top forming below a declining 200-day moving average adds bearish context. A triple bottom forming above a rising 200-day MA adds bullish context.
RSI divergence. Divergence between price and RSI across the three tests is one of the strongest confirmation signals. If price makes three equal highs but RSI makes progressively lower highs, the bearish divergence strongly supports the triple top.
MACD. A MACD bearish crossover or a shift below the zero line during a triple top formation adds confirmation. Similarly, a bullish MACD crossover during a triple bottom supports the reversal thesis.
Bollinger Bands. Narrowing Bollinger Bands during the later stages of a triple pattern indicate declining volatility, which often precedes a significant breakout move.
Common Mistakes
Premature entry. Entering before the neckline break is a frequent error. Until the neckline breaks, the pattern is unconfirmed — price may bounce for a fourth time or break through the resistance/support.
Ignoring volume. A triple pattern without proper volume characteristics (declining on tests, surging on breakout) is less reliable.
Confusing with rectangles. A horizontal trading range with multiple touches on both sides is a rectangle (continuation pattern), not a triple top/bottom. Triple patterns require a preceding trend and specific peak/trough structure.
Poor stop placement. Stops that are too tight (at the nearest peak/trough) get triggered by normal volatility. Use the pattern's extreme (highest peak or lowest trough) for reliable stop placement.
Frequently Asked Questions
How long does a triple top or bottom take to form?
Triple patterns typically take several weeks to several months to complete on daily charts. The three tests of the level need time to develop, with meaningful pullbacks between each test. Compressed patterns that form very quickly are less reliable than those that develop over a longer period.
Is the triple top more reliable than the double top?
Generally, yes. The third test adds confirmation that the level is significant and that the opposing force (buyers for a triple bottom, sellers for a triple top) is genuinely exhausted. However, the longer formation time means the pattern is less common and may produce a smaller remaining move after the breakout.
Can the three peaks/troughs be at slightly different levels?
Yes. A tolerance of approximately 1-3% is acceptable. The peaks/troughs rarely hit the exact same price. What matters is that they test approximately the same zone, demonstrating that the level represents meaningful support or resistance.
What if there is a fourth test of the level?
A fourth test can evolve into a rectangle pattern (if price also bounces off the neckline) or may lead to a breakout through the level on the fourth attempt. If volume increases on the fourth test, the level may be weakening. Reassess the pattern if a fourth test develops.
Can triple patterns appear on intraday charts?
Yes, triple tops and bottoms form on all timeframes. On intraday charts, they typically complete within a single trading session or over a few days. The principles remain the same, but intraday patterns carry less weight than daily or weekly formations.
What is the measured move target accuracy?
The measured move target is achieved approximately 60-70% of the time for confirmed patterns with proper volume characteristics. Some breakouts far exceed the target, while others fall short. Use the measured move as a minimum target and look for additional support/resistance levels for more refined target setting.
Disclaimer
This is educational content, not financial advice. Trading involves risk, and you should consult a qualified financial advisor before making any investment decisions. Past performance does not guarantee future results.
Related Articles
12 chapters covering charts, indicators, risk management & more. Plus weekly trading insights.