On-Balance Volume (OBV): Using Volume to Confirm Trends
⚡ Key Takeaways
- On-Balance Volume (OBV) is a cumulative volume indicator that adds volume on up days and subtracts it on down days to track buying and selling pressure
- OBV trend direction matters more than its absolute value — a rising OBV confirms buying pressure while a falling OBV confirms selling pressure
- OBV divergence from price is a leading signal: when price rises but OBV falls, the rally lacks conviction and may reverse
- OBV breakouts often precede price breakouts, making it a valuable leading indicator for anticipating moves
- OBV works best when combined with price-based indicators like moving averages and support/resistance analysis
What Is On-Balance Volume (OBV)?
On-Balance Volume (OBV) is a cumulative volume indicator that uses volume flow to predict changes in stock price. Developed by Joseph Granville and introduced in his 1963 book Granville's New Key to Stock Market Profits, OBV was one of the first indicators to incorporate volume into technical analysis in a systematic way.
The fundamental premise behind OBV is that volume precedes price. Smart money — institutional investors and informed traders — accumulates positions before prices move up and distributes positions before prices decline. OBV captures this activity by tracking the running total of volume, adding volume on up days and subtracting it on down days.
The actual numerical value of OBV is not important. What matters is the direction and pattern of the OBV line. A rising OBV indicates that volume is flowing into the security (accumulation). A falling OBV indicates that volume is flowing out (distribution). This information is critical for confirming trends and spotting potential reversals before they become obvious on the price chart.
How OBV Is Calculated
The OBV calculation is remarkably simple, which is part of its elegance.
If today's close is greater than yesterday's close:Each day, the total volume is either added to or subtracted from the running OBV total based on whether the closing price moved up or down. This binary approach (all-or-nothing) means that even a small price increase adds the full day's volume to OBV, while a small price decrease subtracts it entirely.
This simplicity is intentional. Granville argued that the direction of the close relative to the previous close was the most important piece of information — it tells you whether buyers or sellers controlled the session. The volume magnitude then tells you how much conviction backed that control.
| Price Change | OBV Action | Interpretation |
|---|---|---|
| Close higher than previous | Add full volume | Buyers dominated |
| Close lower than previous | Subtract full volume | Sellers dominated |
| Close unchanged | No change | Equilibrium |
OBV Trend Analysis
The primary way to use OBV is by analyzing the direction and pattern of the OBV line itself.
Rising OBV indicates that volume is heavier on up days than down days. This confirms that buying pressure is dominant and supports an uptrend in price. When both price and OBV are making higher highs and higher lows, the uptrend is healthy and likely to continue.
Falling OBV indicates that volume is heavier on down days. This confirms selling pressure and supports a downtrend. When both price and OBV are making lower highs and lower lows, the downtrend has conviction behind it.
Flat OBV indicates that buying and selling pressure are roughly balanced. This often occurs during consolidation periods when neither side has a clear advantage. A flat OBV can precede a breakout in either direction.
You can apply all the same trend analysis tools to OBV that you use on price charts. Draw trendlines on OBV, look for support and resistance patterns, and watch for breakouts. An OBV trendline break can foreshadow a price trendline break by several sessions.
Pro Tip
OBV Divergence
OBV divergence is the most powerful signal the indicator produces. Because volume often leads price, divergence between OBV and price can predict moves before they occur.
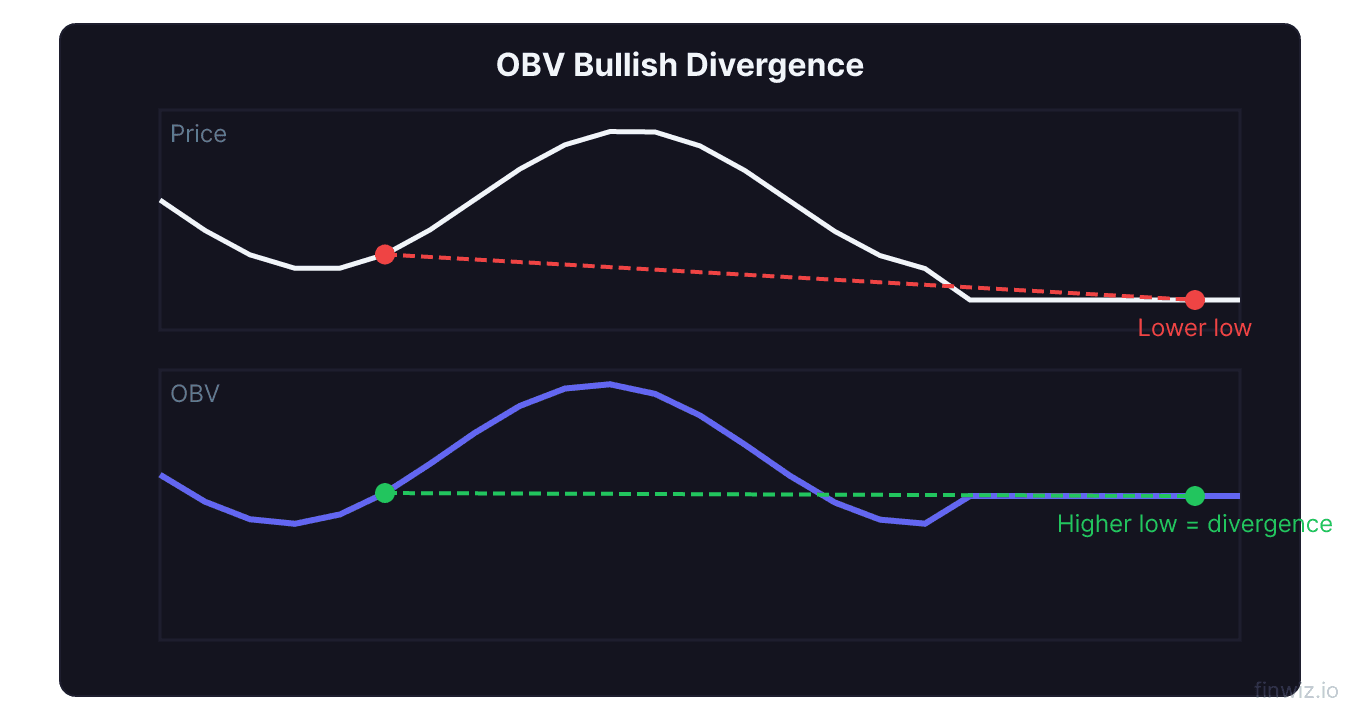
Bullish OBV divergence occurs when price makes a lower low (or equal low), but OBV makes a higher low. This indicates that despite the price weakness, buying volume is actually increasing. Smart money may be accumulating shares at lower prices, and a price reversal to the upside is likely.
Bearish OBV divergence occurs when price makes a higher high (or equal high), but OBV makes a lower high. This reveals that the rally is happening on declining volume — fewer participants are buying at higher prices. Distribution is occurring, and the uptrend may be exhausting itself.
OBV divergence signals are particularly reliable when they occur at significant support and resistance levels, during chart pattern formations, or in conjunction with momentum divergence from RSI or MACD. Multiple divergence signals from different indicators create a powerful convergence of evidence.
OBV and Breakout Confirmation
One of OBV's most practical applications is confirming or warning against price breakouts.
Confirmed breakout: When price breaks above a resistance level and OBV is also breaking above its own resistance level (or making new highs), the breakout is supported by increasing buying pressure. This is a high-probability trade setup. Volume is flowing into the security in a way that confirms the price move is genuine.
Suspicious breakout: When price breaks above resistance but OBV is flat or declining, the breakout lacks volume conviction. This price-only breakout is more likely to be a false move that will reverse. Traders should be cautious and may want to wait for OBV confirmation before entering.
OBV leading breakout: Sometimes OBV breaks above its resistance level before price does. This is an early warning signal that accumulation is underway and a price breakout may follow. Traders who spot this pattern can prepare their entries before the crowd sees the price breakout.
Pro Tip
OBV Trading Strategies
Strategy 1: OBV Trend Confirmation
Use OBV to confirm the health of price trends identified by moving averages. If price is above the 50-day MA and OBV is in an uptrend, the trend is confirmed. If price is above the 50-day MA but OBV is flat or declining, the trend may be weakening despite the price action. This simple filter helps you avoid entering trades in trends that are losing their volume foundation.
Strategy 2: OBV Divergence Reversal
Monitor for OBV divergence at key price levels. When price reaches support and OBV shows bullish divergence (higher OBV low at a lower price low), enter long with a stop below the support level. When price reaches resistance and OBV shows bearish divergence, consider shorting or exiting long positions. The divergence provides early warning that the current move is exhausted.
Strategy 3: OBV Breakout Anticipation
Look for stocks where OBV is breaking above its previous peak while price has not yet broken its resistance. Enter on the OBV breakout with a stop below the recent price low. The target is the price resistance level and beyond. This strategy essentially front-runs the price breakout using volume leadership.
Strategy 4: OBV with RSI
Combine OBV trend analysis with RSI overbought/oversold signals. When RSI reaches oversold and OBV is in an uptrend (indicating ongoing accumulation despite the pullback), the buy signal has extra conviction. When RSI reaches overbought and OBV is in a downtrend, the sell signal is reinforced.
OBV vs. Other Volume Indicators
Several volume indicators compete with OBV for traders' attention. Understanding the differences helps you choose the right tool.
OBV vs. Accumulation/Distribution (A/D): The A/D line uses the close's position within the high-low range to weight the volume, giving a more nuanced view than OBV's binary approach. A/D is considered more precise, while OBV is simpler and more responsive to closing price changes.
OBV vs. Volume Profile: Volume profile shows volume at specific price levels rather than tracking cumulative volume over time. Volume profile identifies key support/resistance based on where the most trading occurred, while OBV tracks the flow of volume in and out over time. They answer different questions and can be used together.
OBV vs. Money Flow Index (MFI): MFI is essentially a volume-weighted RSI. It incorporates both price direction and volume magnitude into a bounded oscillator (0-100). MFI provides overbought/oversold readings that OBV does not, but OBV provides a clearer picture of cumulative buying and selling pressure.
| Indicator | What It Measures | Best For |
|---|---|---|
| OBV | Cumulative buying/selling pressure | Trend confirmation, divergence |
| A/D Line | Volume-weighted close position | Institutional accumulation/distribution |
| Volume Profile | Volume at price levels | Identifying key support/resistance |
| MFI | Volume-weighted momentum | Overbought/oversold with volume |
Common OBV Mistakes
Focusing on OBV's absolute value. The numerical value of OBV is meaningless on its own. What matters is the direction of the OBV line and its pattern relative to price. A rising OBV is bullish regardless of whether the value is 10 million or 100 million.
Using OBV on low-volume stocks. OBV is most reliable on liquid stocks with consistent daily volume. On thinly traded stocks, a single large trade can distort OBV significantly, creating misleading signals. Stick to stocks with average daily volume above 500,000 shares.
Ignoring the binary limitation. OBV adds or subtracts the entire day's volume based solely on whether the close was up or down. A stock that closes 1 cent higher on 10 million shares gets the same positive OBV treatment as one that closes $5 higher on 10 million shares. Be aware of this limitation and use complementary indicators like A/D or MFI for more nuanced analysis when needed.
Not confirming with price. OBV provides context, not standalone trade signals. Always require price confirmation (a breakout, trendline break, or moving average cross) before acting on OBV signals. OBV tells you what volume is doing; you still need price action to tell you when to act.
OBV on Different Timeframes
OBV is most commonly used on daily charts, where each bar represents a full session of buying and selling activity. However, it can be applied to other timeframes.
Weekly OBV smooths out daily fluctuations and reveals the longer-term institutional accumulation or distribution trend. A rising weekly OBV supports long-term bullish positions. This is particularly useful for swing trading and position trading decisions.
Intraday OBV can be used for day trading by tracking cumulative volume throughout the session. However, intraday OBV should be combined with VWAP for a more complete picture of intraday volume dynamics.
Monthly OBV is useful for investors evaluating the long-term health of accumulation in a stock. A stock with a steadily rising monthly OBV is under consistent institutional accumulation, which supports a buy-and-hold thesis.
Frequently Asked Questions
Is OBV a leading indicator?
Yes, OBV is considered a leading indicator because volume changes often precede price changes. When OBV starts rising while price is still flat or declining, it suggests that buying volume is building before the price move occurs. Similarly, when OBV starts declining during a price uptrend, it warns that selling pressure is building ahead of a potential reversal. This leading characteristic is OBV's greatest strength and is based on the principle that smart money acts before prices move.
How do you read OBV for beginners?
For beginners, focus on three things. First, the direction of OBV — is it rising, falling, or flat? A rising OBV is bullish, and a falling OBV is bearish. Second, does OBV agree with the price trend? If both are rising, the trend is healthy. If they disagree (divergence), the trend may be weakening. Third, look for OBV breakouts — when OBV reaches a new high before price does, it often signals an upcoming price breakout. Start with these three observations and add complexity as you become more comfortable.
Can OBV be used for cryptocurrency?
Yes, OBV works well for cryptocurrency trading, especially on major coins and tokens with high daily volume. The principles are identical — rising OBV confirms uptrends, falling OBV confirms downtrends, and divergence warns of potential reversals. However, crypto volume data can be less reliable than stock volume due to exchange reporting differences and wash trading on some platforms. Use OBV data from reputable exchanges and be aware of potential volume data inconsistencies.
What is the difference between OBV and volume bars?
Standard volume bars show the amount of trading activity for each period but do not indicate whether the volume was dominated by buying or selling. OBV adds a directional component by using the closing price to classify each bar's volume as buying or selling pressure. This cumulative directional tracking gives OBV far more analytical power than raw volume bars. Volume bars tell you how much activity occurred; OBV tells you which side controlled that activity.
How often should I check OBV?
For swing trading, checking OBV on the daily chart once per day is sufficient. For day trading, monitoring OBV throughout the session on your intraday chart can help confirm intraday moves. For investing and position trading, weekly OBV analysis is adequate. The key is using OBV as a confirmation tool alongside your primary price analysis rather than as a standalone signal generator. Check it when you are evaluating a potential trade or reviewing an existing position.
Disclaimer
This is educational content, not financial advice. Trading involves risk, and you should consult a qualified financial advisor before making any investment decisions. Past performance does not guarantee future results.
12 chapters covering charts, indicators, risk management & more. Plus weekly trading insights.