Vortex Indicator: Identifying Trend Starts & Reversals
⚡ Key Takeaways
- The Vortex Indicator consists of two lines, +VI (positive vortex) and -VI (negative vortex), that measure upward and downward trend movement
- A bullish signal occurs when +VI crosses above -VI; a bearish signal occurs when -VI crosses above +VI
- The default 14-period setting balances sensitivity with signal quality, though longer periods reduce false signals in choppy markets
- Combining the Vortex Indicator with ADX helps filter out weak crossover signals that occur in trendless markets
- The indicator was inspired by water vortex dynamics and adapted by Etienne Botes and Douglas Siepman based on J. Welles Wilder's True Range concept
What Is the Vortex Indicator?
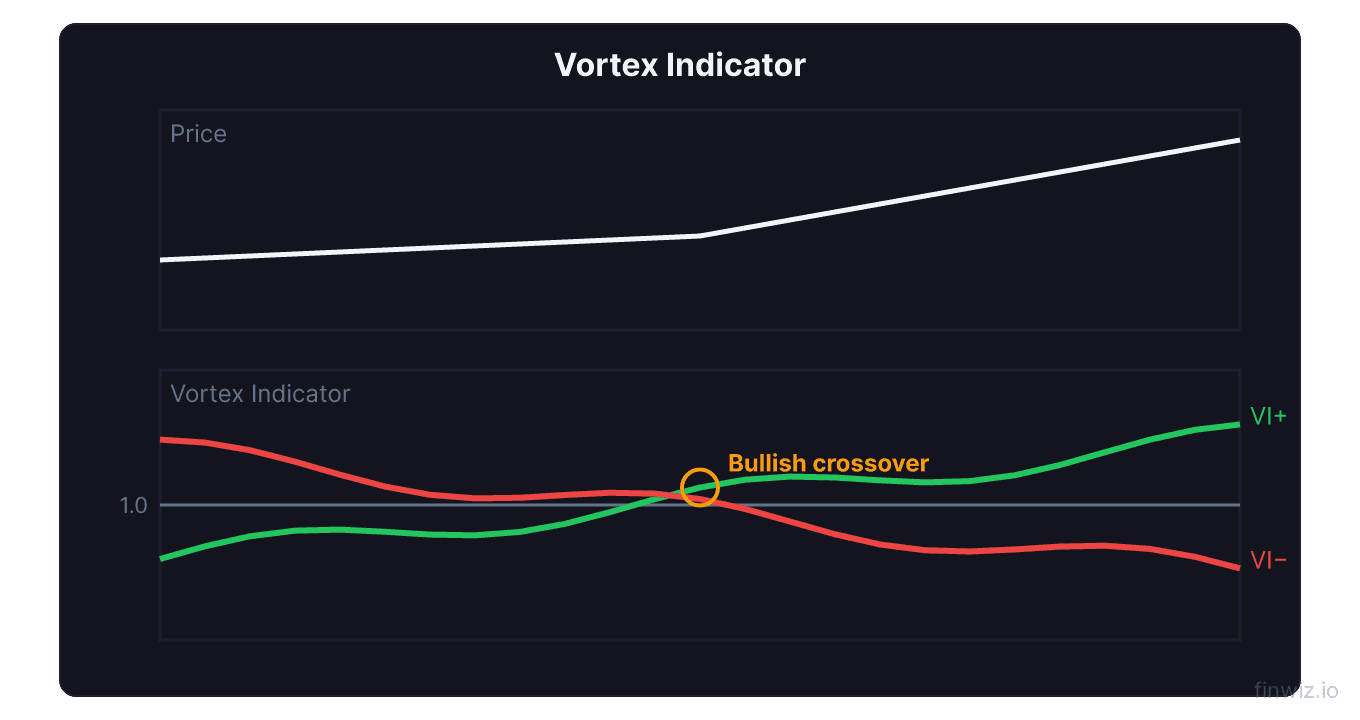
The Vortex Indicator (VI) is a trend-following technical indicator that identifies the start of a new trend and confirms the direction of an existing trend. It consists of two oscillating lines: the positive vortex line (+VI) that captures upward price movement and the negative vortex line (-VI) that captures downward price movement.
Developed by Etienne Botes and Douglas Siepman and introduced in the January 2010 issue of Technical Analysis of Stocks & Commodities magazine, the Vortex Indicator draws its inspiration from the flow dynamics of water vortices. The creators observed that trend movements in financial markets exhibit rotational patterns similar to those found in water dynamics.
The indicator builds on J. Welles Wilder's True Range concept (the same foundation used in the ATR indicator) and measures the relationship between current highs and prior lows (upward vortex movement) and current lows and prior highs (downward vortex movement). When the +VI line is above the -VI line, the trend is bullish. When -VI is above +VI, the trend is bearish.
How the Vortex Indicator Is Calculated
The calculation involves several steps that measure directional movement and normalize it by the True Range.
Step 1: Calculate Vortex MovementThe normalization by True Range is critical because it allows the Vortex Indicator to work across different securities and price levels. Without normalization, a $500 stock would produce much larger vortex movement values than a $50 stock, making comparison impossible.
Both +VI and -VI typically oscillate between approximately 0.70 and 1.30, though they can exceed these bounds during extremely strong trends.
Reading Vortex Indicator Signals
Crossover Signals
The primary signal from the Vortex Indicator is the crossover between the +VI and -VI lines.
Bullish crossover: When +VI crosses above -VI, upward price movement is stronger than downward movement, signaling a potential uptrend. This is a buy signal.
Bearish crossover: When -VI crosses above +VI, downward price movement dominates, signaling a potential downtrend. This is a sell or short signal.
The strength of the crossover signal depends on the separation between the two lines after the cross. A decisive cross where the lines spread apart quickly indicates stronger conviction. A cross where the lines barely separate before coming back together suggests a weak or false signal.
Trend Strength
The distance between +VI and -VI indicates trend strength. When the two lines are far apart, the trend is strong. When they converge and oscillate close together, the market is trendless or in consolidation.
- +VI significantly above -VI (spread > 0.20): Strong uptrend
- -VI significantly above +VI (spread > 0.20): Strong downtrend
- +VI and -VI close together (spread < 0.10): Trendless, choppy market
Pro Tip
Combining Vortex Indicator with ADX
The Vortex Indicator's primary weakness is generating false crossover signals in non-trending markets. The ADX (Average Directional Index) solves this problem by measuring trend strength independently of direction.
The ADX Filter Strategy
Step 1: Check the ADX reading. If ADX is below 20, the market is not trending, and Vortex Indicator crossover signals should be ignored.
Step 2: If ADX is above 20 (and ideally above 25), the market is trending, and Vortex Indicator crossovers become reliable directional signals.
Step 3: Enter on the Vortex crossover in the direction indicated, using the ADX confirmation to filter out noise.
| ADX Reading | Trend Strength | Vortex Signal Reliability |
|---|---|---|
| Below 15 | No trend | Very low, avoid signals |
| 15-20 | Weak trend developing | Low, use caution |
| 20-30 | Moderate trend | Good, signals are actionable |
| 30-50 | Strong trend | High, signals are reliable |
| Above 50 | Extremely strong trend | Very high, but trend may be exhausted |
This combined approach eliminates most whipsaw losses because false crossovers predominantly occur during low-ADX (trendless) periods.
Vortex Indicator Settings
The 14-Period Default
The default 14-period setting was chosen by the creators as a balanced compromise between responsiveness and signal quality. It corresponds to approximately two trading weeks on a daily chart.
Shorter Periods (7-10)
Shorter periods make the Vortex Indicator more responsive to price changes, generating earlier signals. However, this comes with significantly more false crossovers, especially in choppy markets. Shorter periods are suitable for traders who combine the indicator with multiple confirmation tools.
Longer Periods (21-30)
Longer periods smooth the indicator and reduce false signals. The crossovers are slower but more reliable. Traders who use the Vortex Indicator as a primary trend filter rather than a timing tool may prefer longer settings.
| Period | Signal Speed | False Signals | Best For |
|---|---|---|---|
| 7-10 | Fast | Many | Day trading with additional filters |
| 14 (default) | Balanced | Moderate | Swing trading |
| 21-30 | Slow | Few | Position trading, trend identification |
Trading Strategies with the Vortex Indicator
Trend-Following Strategy
This straightforward strategy uses Vortex crossovers for entries and stays in the trade as long as the signal persists.
Entry: Buy when +VI crosses above -VI. Short when -VI crosses above +VI.
Exit: Close the position when the opposite crossover occurs. This keeps you in the trade for the duration of the trend.
Stop loss: Place below the most recent swing low (for longs) or above the most recent swing high (for shorts).
Breakout Confirmation Strategy
Use the Vortex Indicator to confirm chart pattern breakouts. When a stock breaks above resistance, a simultaneous +VI crossover above -VI confirms the breakout has genuine momentum behind it. Without Vortex confirmation, the breakout is more likely to fail.
Multi-Indicator Strategy
Combine the Vortex Indicator with MACD and RSI for a three-layer approach:
- Vortex Indicator: Determines trend direction (+VI above -VI = bullish)
- MACD: Confirms momentum (MACD line above signal line = bullish momentum)
- RSI: Identifies entry timing (RSI pulling back to 40-50 in an uptrend = entry zone)
When all three align, the trade has direction, momentum, and timing confirmation.
Real-World Application
Consider a swing trade on Amazon (AMZN) using the Vortex Indicator on a daily chart with the 14-period default setting.
After a period of consolidation where +VI and -VI were crossing repeatedly (ADX below 20, confirming no trend), the +VI line crossed above -VI in early November 2023. Simultaneously, ADX rose above 20, confirming that a new trend was developing.
The +VI reading reached 1.20 while -VI fell to 0.85, creating a strong 0.35 spread. AMZN rallied approximately 18% over the following six weeks before -VI crossed back above +VI, signaling the trend had ended.
A trader following the basic Vortex crossover strategy with ADX confirmation would have captured the majority of this move while avoiding the preceding choppy period.
Limitations of the Vortex Indicator
Frequent whipsaws in range-bound markets. Without a trend filter like ADX, the Vortex Indicator generates numerous false crossovers during consolidation periods. These whipsaws can erode capital quickly.
Lagging nature. Like most trend-following indicators, the Vortex Indicator confirms trends rather than predicting them. By the time a crossover occurs, a portion of the move has already happened.
No overbought/oversold readings. Unlike oscillators such as RSI or CCI, the Vortex Indicator does not identify overbought or oversold conditions. It tells you the trend direction but not whether the trend is extended.
Sensitivity to gaps. Large price gaps can cause sudden spikes in vortex movement values, potentially generating false signals. This is a concern around earnings announcements and other binary events.
FAQ
Is the Vortex Indicator good for day trading?
The Vortex Indicator can be used for day trading on intraday charts, but reduce the period to 7-10 for faster signals. Always combine it with an ADX filter to avoid whipsaw losses in trendless intraday periods. Volume confirmation is especially important for intraday Vortex signals.
How does the Vortex Indicator compare to MACD?
Both are trend-following indicators, but they measure different things. MACD measures the convergence and divergence of two price-based moving averages. The Vortex Indicator measures the dominance of upward versus downward price movement using True Range normalization. They complement each other well when used together.
What markets work best with the Vortex Indicator?
The Vortex Indicator works best on liquid, trending markets including major stocks, ETFs, forex pairs, and futures. It performs poorly on low-liquidity securities with erratic price action and frequent gaps. Markets that tend to trend (such as commodities and forex) are generally better suited to the indicator than markets that tend to mean-revert.
Should I use the Vortex Indicator alone?
No. The Vortex Indicator's tendency to generate false signals in non-trending markets makes it important to use alongside a trend strength filter like ADX. Adding volume analysis and a momentum oscillator like RSI further improves the quality of signals.
What does it mean when +VI and -VI are both rising?
This is unusual but can occur during periods of increasing volatility without a clear directional trend. Both upward and downward vortex movements are strengthening. This typically precedes a volatile breakout, though the direction remains uncertain until one line decisively crosses above the other.
Disclaimer
This is educational content, not financial advice. Trading involves risk, and you should consult a qualified financial advisor before making any investment decisions. Past performance does not guarantee future results.
Related Articles
12 chapters covering charts, indicators, risk management & more. Plus weekly trading insights.