Ichimoku Cloud: Complete Guide to This All-in-One Indicator
⚡ Key Takeaways
- The Ichimoku Cloud is an all-in-one indicator that shows support/resistance, trend direction, momentum, and trade signals simultaneously
- Price above the cloud is bullish, below the cloud is bearish, and inside the cloud indicates a transitional or indecisive market
- The five components — Tenkan-sen, Kijun-sen, Senkou Span A, Senkou Span B, and Chikou Span — each serve a unique analytical purpose
- The cloud (Kumo) is projected 26 periods into the future, providing forward-looking support and resistance levels
- Ichimoku works best on daily and weekly charts; intraday application requires experience and additional confirmation
What Is the Ichimoku Cloud?
The Ichimoku Cloud, formally known as Ichimoku Kinko Hyo (meaning "one glance equilibrium chart" in Japanese), is a comprehensive technical indicator developed by Japanese journalist Goichi Hosoda in the late 1930s after 30 years of research. He published his findings in 1969, and the system has since become one of the most respected analytical tools in global markets.
What makes Ichimoku unique is that it is an all-in-one indicator. While most indicators measure only one aspect of price behavior — trend direction, momentum, or support/resistance — the Ichimoku Cloud provides all three in a single view. At a glance, you can assess the trend direction, its strength, support and resistance levels, and potential entry and exit signals.
The Ichimoku system may appear intimidating at first due to its five components and the visual complexity of the cloud formation. However, once you understand each piece individually, the system becomes remarkably intuitive and powerful.
The Five Components of Ichimoku
Each of the five Ichimoku components provides distinct information. Let us break down each one.
Tenkan-sen (Conversion Line)
The Tenkan-sen is calculated as the midpoint of the highest high and lowest low over the last 9 periods. It is the fastest-moving component and acts similarly to a short-term moving average. A rising Tenkan-sen indicates short-term bullish momentum, while a falling one suggests bearish momentum.
Kijun-sen (Base Line)
The Kijun-sen uses the same midpoint calculation but over 26 periods, making it a medium-term equilibrium level. It serves as a key support and resistance level and is often used as a trailing stop reference. The Kijun-sen is the most important single line in the Ichimoku system — price tends to revert to this line during pullbacks.
Senkou Span A (Leading Span A)
Senkou Span A is the average of the Tenkan-sen and Kijun-sen, plotted 26 periods into the future. It forms one edge of the cloud.
Senkou Span B (Leading Span B)
Senkou Span B is the midpoint of the highest high and lowest low over the last 52 periods, also plotted 26 periods into the future. It forms the other edge of the cloud and is the slowest component of the system.
Chikou Span (Lagging Span)
The Chikou Span is simply the current closing price plotted 26 periods in the past. It provides a quick visual comparison between the current price and where price was 26 periods ago.
Tenkan-sen = (9-period High + 9-period Low) / 2| Component | Period | Projected | Function |
|---|---|---|---|
| Tenkan-sen | 9 | Current | Short-term momentum and signal line |
| Kijun-sen | 26 | Current | Medium-term trend and support/resistance |
| Senkou Span A | 9 + 26 average | 26 periods ahead | Cloud boundary (faster) |
| Senkou Span B | 52 | 26 periods ahead | Cloud boundary (slower) |
| Chikou Span | Current close | 26 periods behind | Trend confirmation |
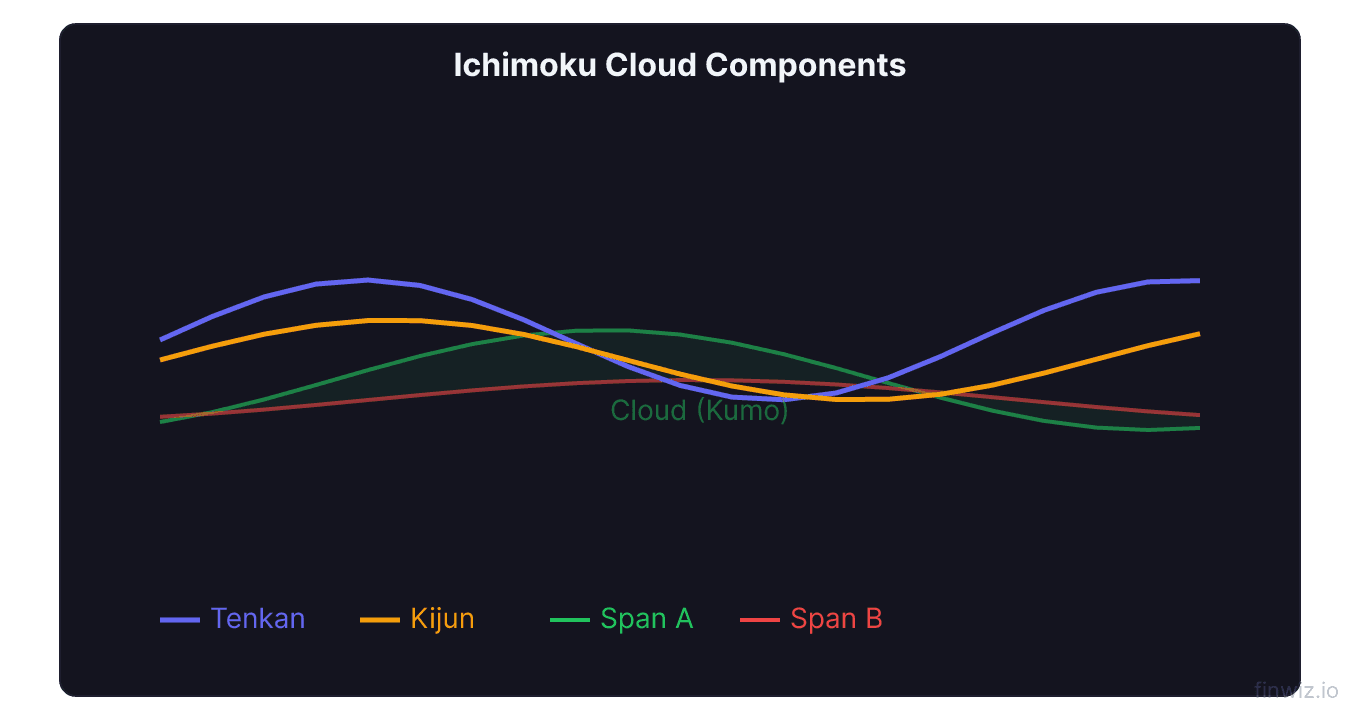
Understanding the Cloud (Kumo)
The Kumo (Cloud) is the shaded area between Senkou Span A and Senkou Span B. It is the most visually distinctive feature of the Ichimoku system and provides the most information at a glance.
Cloud color and direction: When Senkou Span A is above Senkou Span B, the cloud is typically colored green (bullish). When Senkou Span A is below Senkou Span B, the cloud is red (bearish). The twist — where the spans cross and the cloud changes color — is a significant trend reversal signal.
Cloud as support and resistance: The cloud acts as a zone of support in uptrends and resistance in downtrends. Thicker clouds provide stronger support or resistance because they represent a broader zone of equilibrium. Thin clouds are more easily penetrated, suggesting less conviction in the current trend.
Price relative to the cloud: The most fundamental Ichimoku signal is the position of price relative to the cloud. Price above the cloud is bullish. Price below the cloud is bearish. Price inside the cloud indicates a transitional state where the trend is uncertain.
Pro Tip
Ichimoku Trading Signals
The Ichimoku system generates several types of trading signals, each with different levels of strength and reliability.
Tenkan-Kijun Cross (TK Cross)
The most common signal occurs when the Tenkan-sen crosses the Kijun-sen. A bullish cross (Tenkan above Kijun) is similar to a short-term moving average crossing above a longer-term one. A bearish cross (Tenkan below Kijun) signals declining momentum.
The strength of a TK cross depends on its location relative to the cloud:
| TK Cross Location | Signal Strength |
|---|---|
| Above the cloud | Strong bullish signal |
| Inside the cloud | Neutral — wait for confirmation |
| Below the cloud | Weak bullish signal (counter-trend) |
The same logic applies to bearish crosses, reversed — a bearish TK cross below the cloud is a strong sell signal, while one above the cloud is a weak signal.
Kumo Breakout
When price breaks above the cloud, it signals a bullish trend change. When price breaks below the cloud, it signals a bearish shift. Kumo breakouts are among the strongest Ichimoku signals, especially when the cloud is thin (making the breakout cleaner) and accompanied by volume expansion.
Chikou Span Confirmation
The Chikou Span confirms signals by comparing the current price to the price 26 periods ago. If the Chikou Span is above the price from 26 periods ago, it confirms bullish momentum. If below, it confirms bearish momentum. Many Ichimoku traders require Chikou Span confirmation before acting on other signals.
Ichimoku Trading Strategies
Strategy 1: The Complete Ichimoku Signal
The strongest Ichimoku setup occurs when all five components align. For a bullish trade: price is above the cloud, the Tenkan is above the Kijun, the Chikou Span is above the price from 26 periods ago, and the future cloud is bullish (Senkou A above Senkou B). This complete alignment provides the highest probability entry.
Strategy 2: Kumo Twist Strategy
When the cloud changes color (Senkou A crosses Senkou B), it signals a shift in the broader trend equilibrium. Enter in the direction of the new cloud color when price confirms by moving in the same direction. This strategy catches major trend changes early.
Strategy 3: Kijun-sen Bounce
In established trends, price frequently pulls back to the Kijun-sen and bounces. Use the Kijun as a dynamic support level for entries in uptrends and resistance for entries in downtrends. Place your stop on the opposite side of the Kijun-sen. This is analogous to moving average bounce strategies but uses the Ichimoku-specific equilibrium calculation.
Strategy 4: Cloud as Support/Resistance Zone
When price enters the cloud, wait for it to emerge on one side or the other. Enter in the direction of the breakout from the cloud. The cloud edge that price broke through becomes your stop-loss level. This strategy is especially effective when combined with momentum confirmation from MACD or RSI.
Ichimoku Settings
The default Ichimoku settings of 9, 26, 52 were developed for the Japanese stock market, which historically traded six days per week. The 9 represents one and a half weeks, 26 represents one month, and 52 represents two months.
| Setting | Default | Western Adjustment | Use Case |
|---|---|---|---|
| Tenkan | 9 | 7 or 10 | Short-term momentum |
| Kijun | 26 | 22 or 30 | Medium-term equilibrium |
| Senkou B | 52 | 44 or 60 | Long-term trend reference |
| Displacement | 26 | 22 or 30 | Cloud projection period |
Some traders adjust the settings for Western markets (which trade five days per week) to 7, 22, 44. Others argue that the default settings have become self-fulfilling due to widespread use and should be kept as-is. The default settings work well on daily and weekly charts across most markets.
Pro Tip
Ichimoku on Different Markets
Stocks: Ichimoku works exceptionally well on stock daily and weekly charts. The cloud provides clear trend zones, and the TK cross generates timely signals. Large-cap stocks with established trends produce the most reliable Ichimoku signals.
Forex: Ichimoku originated in Asian markets and is especially popular among forex traders. The 24-hour nature of forex means the daily chart captures a full day of global trading. The cloud provides excellent support and resistance levels for currency pairs.
Cryptocurrency: Ichimoku has gained significant popularity in crypto trading. The extended trends common in crypto markets play to Ichimoku's strength as a trend-following system. Use daily or 4-hour charts for the best results.
Futures and commodities: Trending commodity markets like oil, gold, and agricultural futures respond well to Ichimoku analysis. The cloud's forward projection is particularly useful for identifying upcoming support in markets driven by seasonal trends.
Common Ichimoku Mistakes
Using Ichimoku on very short timeframes. The system was designed for daily charts and performs best there or on weekly charts. Using Ichimoku on 1-minute or 5-minute charts produces excessive noise. If you must use it intraday, stick to 1-hour or 4-hour charts as the minimum.
Ignoring components. Some traders only look at the cloud and ignore the Tenkan, Kijun, and Chikou Span. The system is designed to be used as a complete package. Each component adds context that improves signal quality.
Trading inside the cloud. When price is inside the cloud, the market is in transition and the trend is unclear. Taking directional trades inside the cloud has a lower success rate. Wait for price to break out of the cloud before committing to a direction.
Not checking the Chikou Span. The Chikou Span is the confirmation component that many traders overlook. A bullish signal without Chikou confirmation (Chikou above price) is significantly weaker. Always check this line before entering a trade.
Frequently Asked Questions
Is the Ichimoku Cloud good for beginners?
The Ichimoku Cloud can be overwhelming for beginners due to its five components and visual complexity. However, the underlying concepts are actually straightforward once learned. Starting with the cloud alone (price above or below) provides a simple trend filter that even beginners can use immediately. As you become more comfortable, add the Tenkan-Kijun cross, then the Chikou Span confirmation. This incremental approach makes Ichimoku accessible without requiring you to master everything at once.
What timeframe works best for Ichimoku?
The daily chart is the gold standard for Ichimoku analysis. The indicator was developed using daily data over 30 years of research, and its default settings are optimized for daily charts. Weekly charts also work very well for identifying long-term trends. For shorter timeframes, the 4-hour chart is the minimum recommended. Charts below 1-hour produce excessive noise with Ichimoku and are generally not recommended unless combined with additional filters.
How does Ichimoku compare to moving averages?
Ichimoku and moving averages share some conceptual similarities — both identify trends and provide dynamic support and resistance. However, Ichimoku provides significantly more information. Its forward-projected cloud gives a view of future support and resistance that moving averages cannot. The multi-component system measures both short-term and long-term equilibrium simultaneously. Moving averages are simpler and sufficient for many traders, while Ichimoku is better for those who want a comprehensive, all-in-one system.
Can Ichimoku be used with other indicators?
Yes, while Ichimoku is designed as a standalone system, many traders enhance it with complementary indicators. Volume analysis adds a dimension that Ichimoku does not address. RSI can confirm overbought or oversold conditions at cloud boundaries. MACD can validate momentum shifts identified by the TK cross. The key is adding indicators that provide information Ichimoku does not cover rather than redundant trend signals.
Disclaimer
This is educational content, not financial advice. Trading involves risk, and you should consult a qualified financial advisor before making any investment decisions. Past performance does not guarantee future results.
Related Articles
12 chapters covering charts, indicators, risk management & more. Plus weekly trading insights.