Volume Profile: How to Read & Trade High-Volume Price Levels
⚡ Key Takeaways
- Volume Profile displays trading volume at specific price levels rather than over time, revealing where the most significant trading activity occurred
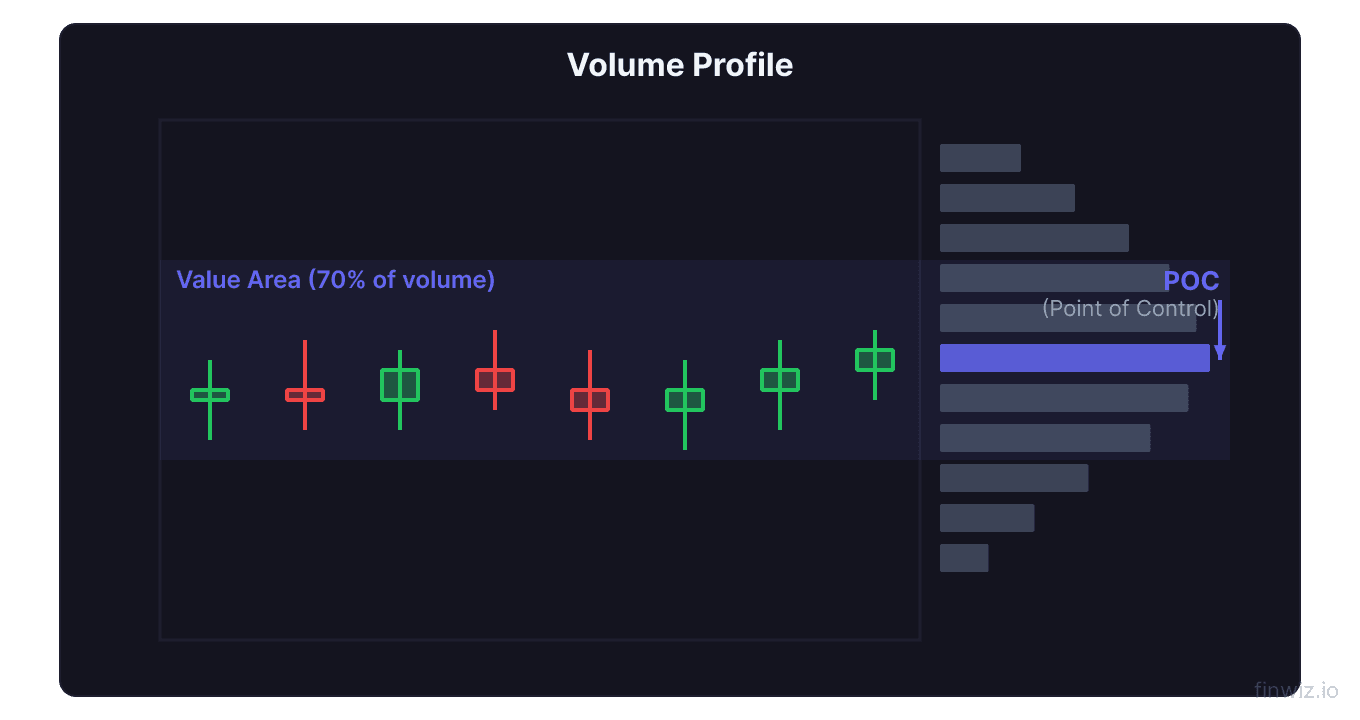
- The Point of Control (POC) is the price level with the highest volume — it acts as a magnet for price and a key support/resistance level
- The Value Area (VA) contains 70% of all traded volume and defines the fair value zone where most participants are comfortable trading
- High Volume Nodes (HVN) act as support/resistance magnets, while Low Volume Nodes (LVN) are areas price moves through quickly
- Volume Profile is used by institutional traders to identify supply/demand zones and is one of the most advanced tools in technical analysis
What Is Volume Profile?
Volume Profile is an advanced charting tool that displays the amount of trading volume at specific price levels over a defined time period. Unlike traditional volume bars that show volume per time period (how much was traded when), Volume Profile shows volume per price level (how much was traded where).
This distinction is crucial. Knowing that 10 million shares were traded on Tuesday is useful, but knowing that 4 million of those shares were traded between $150 and $152 is far more actionable. Volume Profile reveals the price levels where the most trading activity occurred, which are the levels institutional traders and algorithms reference for support and resistance decisions.
Volume Profile is used extensively by professional and institutional traders because it provides a transparency layer into market structure that price action alone cannot reveal. It shows you where the big money has been active, where fair value exists, and where price is likely to find support or resistance on future visits.
Key Volume Profile Components
Understanding the terminology is essential for reading Volume Profile effectively.
Point of Control (POC)
The Point of Control is the single price level with the highest traded volume within the profile period. It represents the price level where the market found the most agreement between buyers and sellers — the ultimate fair value price. POC acts as a powerful magnet for price. After price moves away from POC, it frequently returns to this level, especially during consolidation phases.
Value Area (VA)
The Value Area encompasses the price range containing approximately 70% of all traded volume within the profile. It is defined by the Value Area High (VAH) and Value Area Low (VAL). The value area represents the range where most market participants were comfortable trading.
| Component | Definition | Trading Significance |
|---|---|---|
| POC | Highest volume price level | Strongest support/resistance, price magnet |
| VAH | Upper boundary of 70% volume zone | Resistance in ranges, breakout level |
| VAL | Lower boundary of 70% volume zone | Support in ranges, breakdown level |
| HVN | Areas of concentrated volume | Support/resistance zones, consolidation areas |
| LVN | Areas of thin volume | Price moves quickly through these, breakout zones |
High Volume Nodes (HVN)
High Volume Nodes are price areas where a large amount of trading occurred. These areas act as attraction points for price because many participants have positions there. HVNs create zones of support and resistance because the concentration of positions means traders will defend these levels.
Low Volume Nodes (LVN)
Low Volume Nodes are price areas with relatively little trading activity. Price tends to move through LVNs quickly because there is little supply or demand to slow it down. LVNs often separate HVNs and act as transition zones or potential breakout areas.
Pro Tip
Types of Volume Profile
There are several ways to display Volume Profile, each serving a different analytical purpose.
Session Volume Profile
Session profile shows the volume distribution for each individual trading session. It helps day traders identify intraday support, resistance, and fair value levels. Each day produces its own POC, VAH, and VAL.
Visible Range Volume Profile (VPVR)
VPVR calculates the volume profile for all bars visible on your current chart view. As you scroll or zoom, the profile recalculates. This is the most flexible option and is popular for quick analysis across any timeframe.
Fixed Range Volume Profile
This allows you to select a specific date range and calculate the volume profile for that period. It is useful for analyzing volume around specific events — earnings announcements, breakouts, or trend reversals.
Composite Volume Profile
The composite profile aggregates volume data over an extended period (weeks or months) to show the broader structural picture of where volume is concentrated. This is the most useful version for identifying major institutional support and resistance levels.
How Institutional Traders Use Volume Profile
Institutional traders rely heavily on Volume Profile because it reveals the footprint of large orders that are invisible on standard charts.
When institutions accumulate a position, they typically buy over an extended period within a defined price range. This buying activity creates a visible HVN on the Volume Profile. The resulting support level is not based on a trendline or moving average — it is based on actual order flow.
Similarly, when institutions distribute (sell) positions, the selling creates HVNs at the distribution price range. These become resistance levels that persist until the positioned volume is absorbed.
Understanding this dynamic allows retail traders to align with institutional positioning. When price returns to an HVN where institutions accumulated, those institutions are likely to defend the level with additional buying. When price approaches an HVN where distribution occurred, selling pressure is likely to resume.
The combination of Volume Profile with VWAP provides a comprehensive institutional-level view of market structure that few retail traders utilize effectively.
Volume Profile Trading Strategies
Strategy 1: POC Reversion
When price moves away from the POC during the trading day, it often reverts back to it, especially during balanced, range-bound sessions. Identify the developing session POC early and look for mean-reversion trades back toward it when price reaches extremes. Use VWAP deviation bands as additional confirmation of the extreme.
Strategy 2: Value Area Breakout
When price breaks above the VAH or below the VAL with conviction (strong volume and momentum), it signals a potential trend day. Enter in the direction of the breakout and target the nearest HVN or the previous day's POC. This strategy captures the transition from a balanced (range-bound) market to an imbalanced (trending) market.
Strategy 3: HVN Support/Resistance
Identify major HVNs from composite or fixed-range profiles on the daily chart. When price pulls back to an HVN in an uptrend, look for buying opportunities using RSI oversold signals or moving average bounces for entry timing. These levels have the strongest institutional backing.
Strategy 4: LVN Breakout Acceleration
When price approaches a LVN, anticipate rapid price movement through the thin volume zone. Position yourself ahead of the LVN if you expect a breakout, or wait for price to clear the LVN and enter on the other side. LVNs between two HVNs create a natural setup — price will move quickly from one HVN through the LVN to the next HVN.
Pro Tip
Volume Profile Shapes and Market Structure
The shape of the Volume Profile tells you about the market's behavior during that period.
D-shaped profile (Normal Distribution): Volume is concentrated in the middle with thin tails above and below. This indicates a balanced market where price found equilibrium and rotated around a fair value. These profiles are common on range-bound days.
P-shaped profile: Heavy volume at the top of the range with a thin tail below. This often forms during strong buying activity, where price rallied quickly (thin tail) and then consolidated at higher prices (heavy volume at top). It is bullish because it shows accumulation at elevated levels.
b-shaped profile: Heavy volume at the bottom of the range with a thin tail above. The mirror of a P-shaped profile. This indicates selling pressure followed by consolidation at lower levels. It can suggest distribution or a bearish continuation.
Double distribution: Two distinct HVNs separated by a LVN. This shape forms when the market moves from one value area to another during the session. It indicates a trending day where the market repriced from one level to another.
| Profile Shape | Volume Distribution | Market Type | Implication |
|---|---|---|---|
| D-shape | Centered, bell curve | Balanced/Range day | Fair value established |
| P-shape | Heavy at top, thin tail below | Buying day | Bullish accumulation |
| b-shape | Heavy at bottom, thin tail above | Selling day | Bearish distribution |
| Double Distribution | Two peaks, LVN between | Trend day | Market repriced |
Combining Volume Profile with Other Indicators
Volume Profile is most powerful when integrated with other technical tools.
Volume Profile + VWAP: This is the premier institutional combination. VWAP provides the volume-weighted average for the session, while Volume Profile shows the volume distribution at each price level. When VWAP coincides with the POC, the level is exceptionally significant. When they diverge, VWAP tells you the average while POC tells you the mode — both are useful reference points.
Volume Profile + Fibonacci: When a Fibonacci retracement level aligns with an HVN, the support or resistance at that price is reinforced by both mathematical proportionality and actual order flow. These confluence zones produce some of the highest probability setups in technical analysis.
Volume Profile + Support/Resistance: Traditional horizontal support and resistance levels gain additional significance when they coincide with HVNs from the Volume Profile. The combination of historical price reactions and demonstrated trading interest creates levels that are extremely difficult for price to break through.
Volume Profile + Bollinger Bands: Bollinger Band extremes that coincide with LVNs suggest that price is at both a statistical extreme and a thin volume zone — a combination that frequently produces sharp reversals.
Common Volume Profile Mistakes
Using Volume Profile without understanding market context. Volume Profile is a structural tool. It shows you where significant trading occurred, but you still need to understand why. A HVN from distribution is a resistance level, while a HVN from accumulation is a support level. Context from price action and trend analysis is essential.
Over-relying on the POC. While the POC is important, the entire Value Area matters. Focusing solely on POC and ignoring VAH, VAL, and the HVN/LVN structure limits your analysis. The full profile shape provides a richer picture.
Using too short a time period. Volume profiles calculated over very short periods may not capture meaningful institutional activity. For swing trading, use at least 20-30 trading days. For day trading, use the full session profile plus composite profiles from recent weeks.
Ignoring developing profile during the day. The Volume Profile evolves throughout the trading day. Early in the session, the profile is immature. As the day progresses, the POC may shift, and new HVNs may form. Monitor how the profile develops and adjust your analysis accordingly.
Frequently Asked Questions
Is Volume Profile suitable for beginners?
Volume Profile is an advanced tool that requires some foundational knowledge of technical analysis. Beginners should first master basic concepts like support and resistance, moving averages, and standard volume analysis before diving into Volume Profile. However, even beginners can benefit from the simplest Volume Profile concept: buying near HVNs in uptrends (where institutional support exists) and avoiding LVNs (where price may move unpredictably). Start with the POC and Value Area concepts and expand from there.
What platform supports Volume Profile?
Most professional charting platforms support Volume Profile, including TradingView, Thinkorswim, Sierra Chart, NinjaTrader, and Bloomberg Terminal. TradingView offers VPVR (Visible Range Volume Profile) and Fixed Range Volume Profile in its paid plans. Thinkorswim provides session volume profile as a standard feature. The quality and customization options vary by platform, so choose one that allows you to adjust the number of rows, time periods, and display settings.
How does Volume Profile differ from standard volume?
Standard volume shows the total number of shares or contracts traded per time period (per candle), displayed as bars at the bottom of the chart. Volume Profile shows the total volume at each price level, displayed as a horizontal histogram alongside the price chart. Standard volume tells you when activity occurred; Volume Profile tells you where it occurred. Both are useful, and the most complete analysis uses both together.
Can Volume Profile be used for swing trading?
Yes, Volume Profile is excellent for swing trading. Use a composite profile covering the last 20-60 trading days to identify major HVNs and LVNs. These levels serve as reliable support and resistance for multi-day trades. Enter long positions near major HVNs in uptrends and set profit targets at the next HVN or LVN boundary. The structural nature of Volume Profile levels gives them persistence — they remain relevant for days or weeks, aligning well with the swing trading timeframe.
What is the best time period for Volume Profile analysis?
The best time period depends on your trading style. Day traders should use the current session profile for intraday decisions and previous session profiles for key reference levels. Swing traders benefit from 20-30 day composite profiles that capture the recent structural picture. Position traders and investors can use 3-6 month profiles to identify major institutional accumulation and distribution zones. Using multiple time periods simultaneously provides the most complete analysis, with short-term profiles for timing and long-term profiles for structural context.
Disclaimer
This is educational content, not financial advice. Trading involves risk, and you should consult a qualified financial advisor before making any investment decisions. Past performance does not guarantee future results.
Related Articles
12 chapters covering charts, indicators, risk management & more. Plus weekly trading insights.