Elder Ray Index: Bull & Bear Power for Trend Analysis
⚡ Key Takeaways
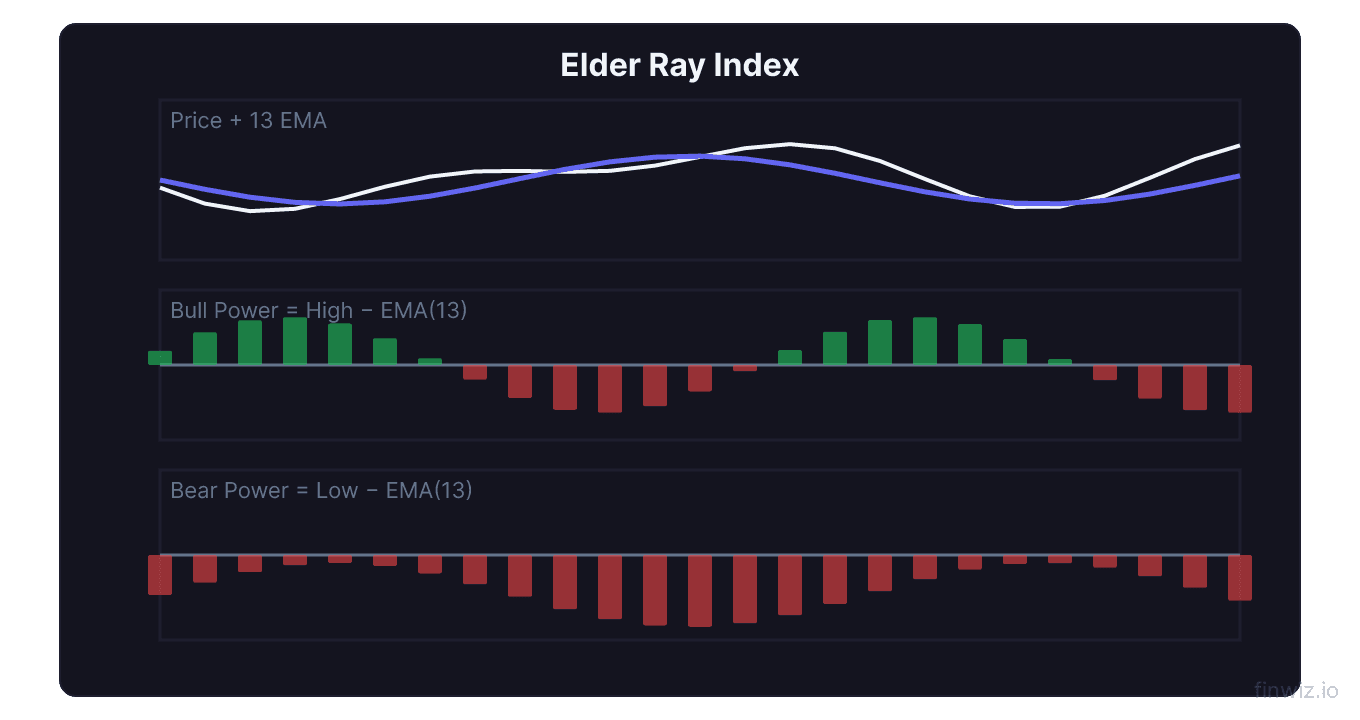
- The Elder-Ray Index, developed by Dr. Alexander Elder, measures the power of bulls and bears separately using Bull Power and Bear Power, both calculated relative to a 13-period EMA.
- Bull Power equals High minus 13-EMA — it measures how far above the EMA bulls can push prices during a session. Bear Power equals Low minus 13-EMA — it measures how far below the EMA bears can push prices.
- The strongest buy signals occur when Bear Power is negative but rising (bears are weakening) while the 13-EMA is rising. The strongest sell signals occur when Bull Power is positive but falling while the EMA is declining.
- Divergence between Bull Power/Bear Power and price provides early warning of trend reversals — especially bearish divergence in Bull Power at market tops.
- The Elder-Ray Index is a core component of Dr. Elder
What Is the Elder-Ray Index?
The Elder-Ray Index is a technical indicator created by Dr. Alexander Elder, a professional trader and author of the influential book Trading for a Living. The indicator separates the power of buyers (bulls) and sellers (bears) into two distinct components — Bull Power and Bear Power — to provide a nuanced view of the balance between buying and selling pressure.
The core insight behind the Elder-Ray is that every session's high reflects the maximum power of bulls (the highest price they could push to), while every session's low reflects the maximum power of bears (the lowest price they could push to). By measuring these extremes relative to a consensus value (the exponential moving average), you can gauge whether bulls or bears are gaining or losing strength.
Dr. Elder designed the indicator to work as part of his Triple Screen trading system, but the Elder-Ray can be used effectively on its own or combined with other analytical tools.
The Elder-Ray Formula
Bull Power = High - 13-period EMAUnderstanding Bull Power
Bull Power measures the distance between the session's high and the 13-period EMA. The high represents the maximum price that buyers achieved during the session. By comparing it to the EMA (which represents the consensus value), Bull Power quantifies how far above consensus the bulls could push.
- Positive Bull Power: The high is above the EMA — bulls are strong enough to push above consensus
- Negative Bull Power: The high is below the EMA — bulls are so weak they could not even reach consensus (very bearish)
- Rising Bull Power: Bulls are gaining strength
- Falling Bull Power: Bulls are losing strength
Understanding Bear Power
Bear Power measures the distance between the session's low and the 13-period EMA. The low represents the maximum price decline that sellers achieved. By comparing it to the EMA, Bear Power quantifies how far below consensus the bears could push.
- Negative Bear Power: The low is below the EMA — bears are strong enough to push below consensus (normal in most conditions)
- Positive Bear Power: The low is above the EMA — bears are so weak they cannot even push to consensus (very bullish)
- Rising Bear Power (becoming less negative): Bears are weakening
- Falling Bear Power (becoming more negative): Bears are strengthening
Pro Tip
Interpreting Elder-Ray Signals
Buy Signals
The strongest buy setups with the Elder-Ray occur when:
- The 13-EMA is rising (confirming the uptrend direction)
- Bear Power is negative but rising (bears are losing strength)
- Bear Power turns up from a new low (divergence developing)
- Bull Power is rising (bulls are gaining momentum)
The ideal long entry occurs when bears are near their weakest recent point and beginning to lose their grip, while the overall trend (EMA direction) remains bullish.
Sell Signals
The strongest sell setups occur when:
- The 13-EMA is falling (confirming the downtrend direction)
- Bull Power is positive but falling (bulls are losing strength)
- Bull Power turns down from a new high (divergence developing)
- Bear Power is falling (bears are gaining momentum)
Signal Summary Table
| EMA Direction | Bull Power | Bear Power | Signal |
|---|---|---|---|
| Rising | Rising | Negative, rising | Strong buy |
| Rising | Flat/rising | Positive | Very strong uptrend (hold) |
| Rising | Falling | Negative, falling | Trend weakening — caution |
| Falling | Positive, falling | Falling | Strong sell |
| Falling | Negative | Falling | Very strong downtrend (hold short) |
| Falling | Rising | Negative, rising | Trend weakening — caution on shorts |
Divergence with Elder-Ray
Like most oscillators, divergence between the Elder-Ray components and price provides powerful reversal warnings.
Bullish Divergence in Bear Power
Price makes a lower low while Bear Power makes a higher low. Even though price is declining, bears are losing their ability to push to new extremes below the EMA. This signals that selling pressure is fading and a reversal may be near.
This divergence is most powerful when it occurs at key support levels or Fibonacci retracement zones, and when the 13-EMA is beginning to flatten from a decline.
Bearish Divergence in Bull Power
Price makes a higher high while Bull Power makes a lower high. Despite rising prices, bulls are losing their ability to push to new extremes above the EMA. This warns that buying pressure is fading.
Bearish Bull Power divergence at resistance levels or after extended rallies is one of the Elder-Ray's most valuable signals.
Pro Tip
The Triple Screen Trading System
Dr. Elder designed the Elder-Ray as a component of his Triple Screen trading system, which uses three levels of analysis to filter trades.
Screen 1: Trend (Weekly Chart)
Identify the major trend direction using a weekly chart and a trend-following indicator such as:
- Weekly MACD histogram slope (rising = bullish, falling = bearish)
- Weekly moving average direction
- Weekly 13-EMA direction
Trade only in the direction of the weekly trend.
Screen 2: Oscillator (Daily Chart)
Use the daily Elder-Ray to identify counter-trend pullbacks within the weekly trend:
- Weekly trend is bullish: Look for daily Bear Power to reach a low and turn up (pullback exhaustion) — this is your buy signal
- Weekly trend is bearish: Look for daily Bull Power to reach a high and turn down (rally exhaustion) — this is your sell signal
Screen 3: Entry Timing (Intraday or Order Placement)
Use a trailing buy stop (in an uptrend) or trailing sell stop (in a downtrend) for precise entry:
- Buying: Place a buy stop above the prior day's high; lower it each day until triggered
- Selling: Place a sell stop below the prior day's low; raise it each day until triggered
| Screen | Timeframe | Tool | Purpose |
|---|---|---|---|
| 1 | Weekly | MACD / EMA trend | Determine direction |
| 2 | Daily | Elder-Ray | Identify pullback entry |
| 3 | Intraday/order | Trailing stop order | Time the entry |
The Triple Screen's power lies in multi-timeframe alignment: you trade in the weekly direction, enter on daily pullbacks identified by the Elder-Ray, and time your entry precisely with order-based techniques.
The 13-Period EMA: Why This Setting?
Dr. Elder chose the 13-period EMA as the Elder-Ray's reference point for several reasons:
- It is close to two trading weeks (10 days), providing a short-to-medium-term consensus value
- The EMA weighting gives more emphasis to recent prices, making it more responsive than a simple moving average
- 13 is a Fibonacci number, which aligns with the natural market rhythms that many technical analysts follow
While 13 is the standard setting, some traders experiment with alternative EMA periods:
| EMA Period | Application | Responsiveness |
|---|---|---|
| 8-10 | Short-term / day trading | High (more signals, more noise) |
| 13 | Standard (Elder's recommendation) | Balanced |
| 21-26 | Swing / position trading | Lower (fewer, more reliable signals) |
If you change the EMA period, adjust your signal interpretation accordingly. Shorter EMAs make Bull and Bear Power more volatile, while longer EMAs smooth them out.
Practical Trading Examples
Buying the Pullback in an Uptrend
- Confirm the 13-EMA is rising (uptrend in place)
- Wait for a pullback that pushes Bear Power below zero (bears are active during the pullback)
- Look for Bear Power to reach a relative low and begin rising (bears exhausting)
- Enter long when Bear Power crosses above its recent low
- Place stop below the pullback low
- Target the prior swing high or use Fibonacci extensions for target projection
Selling the Rally in a Downtrend
- Confirm the 13-EMA is falling (downtrend in place)
- Wait for a relief rally that pushes Bull Power well above zero
- Look for Bull Power to peak and begin falling (bulls exhausting on the bounce)
- Enter short when Bull Power crosses below its recent high
- Place stop above the rally high
- Target the prior swing low
Combining with Other Indicators
MACD. Use MACD for trend direction on the higher timeframe and Elder-Ray for entry timing on the lower timeframe. This is the essence of the Triple Screen system.
RSI. Combine RSI overbought/oversold readings with Elder-Ray divergence for powerful reversal signals. RSI divergence plus Bull Power divergence at resistance is a high-confidence sell signal.
Bollinger Bands. When price reaches the outer Bollinger Band and Elder-Ray divergence is present, the case for reversal is strengthened by both a statistical extreme and a momentum shift.
Volume indicators. Use OBV or Accumulation/Distribution to confirm whether the Elder-Ray's power readings are supported by genuine volume flows.
Limitations
EMA dependency. The indicator's readings are entirely relative to the 13-period EMA. If the EMA itself is distorted by unusual price action (gaps, spikes), Bull and Bear Power readings may be misleading.
Not a standalone system. Dr. Elder designed the Elder-Ray to be used as part of the Triple Screen system, not in isolation. Using it alone produces suboptimal results because it lacks a trend filter.
Lagging signals. Both Bull Power and Bear Power react to price rather than leading it. Divergence signals are more anticipatory but still require the initial extreme to form before the divergence can be identified.
Less popular. The Elder-Ray is less widely followed than indicators like RSI, MACD, or Bollinger Bands. This means fewer traders are watching its signals, which could reduce the self-fulfilling aspect that benefits more popular indicators.
Frequently Asked Questions
Is the Elder-Ray Index the same as the Force Index?
No. Both were developed by Dr. Alexander Elder, but they measure different things. The Elder-Ray measures Bull Power and Bear Power relative to the EMA. The Force Index measures the force behind price moves by combining price change with volume. They complement each other well within Elder's trading framework.
Can I use the Elder-Ray on weekly charts?
Yes. On weekly charts, the Elder-Ray provides a longer-term perspective on bull-bear power dynamics. Use it as your Screen 1 (trend) indicator on weekly charts, or apply it on weekly charts for position trading entries. Weekly Elder-Ray divergences are rare but highly significant.
What is the best market for the Elder-Ray?
The Elder-Ray works across all markets — stocks, forex, futures, and ETFs. It is particularly effective in markets that exhibit clear trending behavior with periodic pullbacks, as the indicator is designed to identify pullback exhaustion within trends.
How do I know when to exit an Elder-Ray trade?
Exit when the conditions that triggered the entry reverse. For a long trade entered on rising Bear Power: exit when Bear Power begins falling sharply again, when the 13-EMA turns down, or when Bull Power divergence develops (warning of a top). Alternatively, use the ATR for trailing stop placement.
Can beginners use the Elder-Ray?
The Elder-Ray is an intermediate-level indicator that requires understanding of EMAs, divergence, and multi-timeframe analysis. Beginners should first master basic candlestick patterns, support and resistance, and simpler oscillators like RSI before incorporating the Elder-Ray into their analysis.
Does the Elder-Ray work in range-bound markets?
The Elder-Ray is a trend-trading tool and performs poorly in range-bound markets. In sideways conditions, Bull Power and Bear Power oscillate without clear directional signals, generating choppy readings. Use the ADX to identify ranging conditions and avoid Elder-Ray signals during low-ADX periods.
Disclaimer
This is educational content, not financial advice. Trading involves risk, and you should consult a qualified financial advisor before making any investment decisions. Past performance does not guarantee future results.
Related Articles
12 chapters covering charts, indicators, risk management & more. Plus weekly trading insights.