Accumulation/Distribution Line: Following Smart Money
⚡ Key Takeaways
- The Accumulation/Distribution (A/D) line is a volume-based indicator that measures the cumulative flow of money into and out of a security by combining price and volume data.
- The A/D line uses the close
- s range (the Close Location Value) to determine whether volume is counted as accumulation (buying) or distribution (selling).
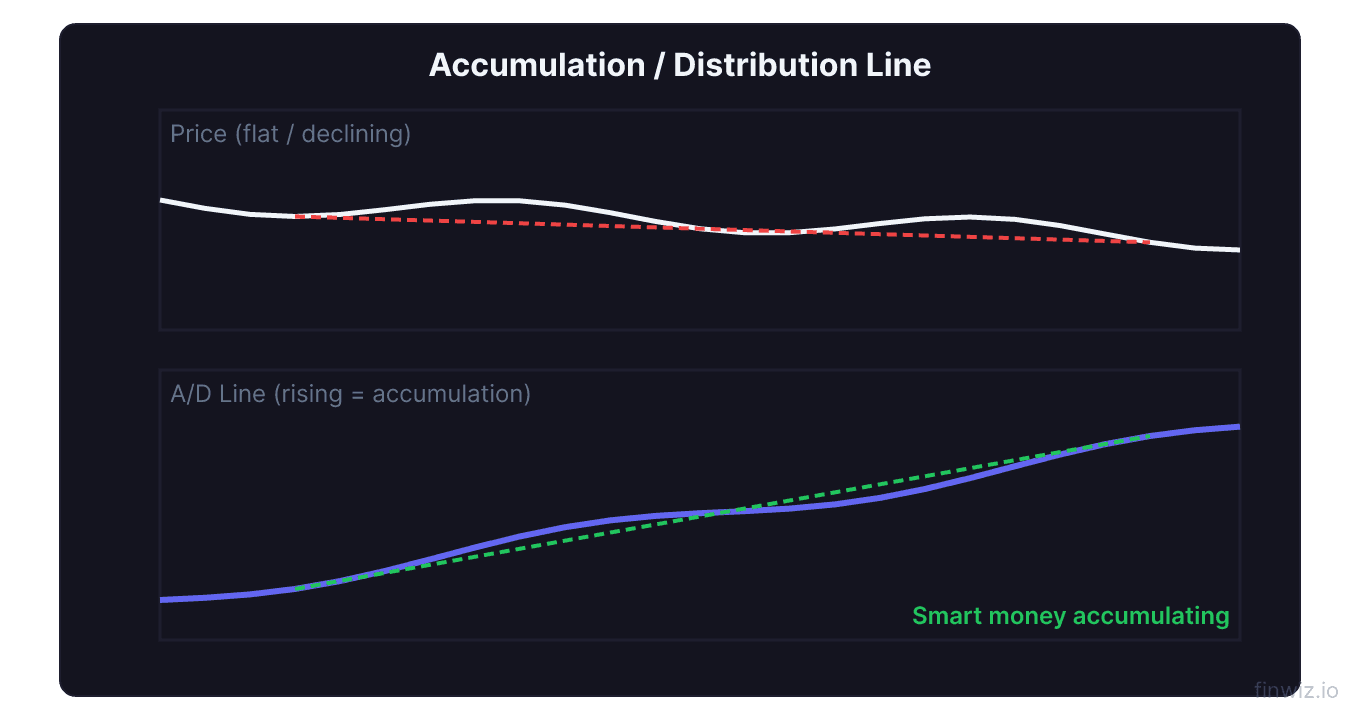
- Divergence between the A/D line and price is the most powerful signal — rising A/D with falling price signals hidden accumulation, while falling A/D with rising price signals hidden distribution.
- Unlike On-Balance Volume (OBV), which assigns all volume to either buying or selling, the A/D line proportionally allocates volume based on where the close falls within the range.
- The A/D line is most effective for identifying smart money behavior — institutional buying or selling that precedes visible price movements.
What Is the Accumulation/Distribution Line?
The Accumulation/Distribution (A/D) line is a cumulative volume-based indicator created by Marc Chaikin that attempts to measure the flow of money into and out of a security. It operates on a fundamental premise: when smart money is accumulating (buying) a stock, the close tends to be in the upper portion of the day's range, and when smart money is distributing (selling), the close tends to be in the lower portion.
By tracking this relationship between closing price position and volume over time, the A/D line reveals whether a security is under accumulation (net buying pressure) or distribution (net selling pressure) — even when the price action itself may not clearly show it.
The A/D line is one of several volume-based indicators in the technical analyst's toolkit, alongside On-Balance Volume (OBV), Chaikin Money Flow (CMF), and the Money Flow Index (MFI). Each takes a slightly different approach to interpreting the volume-price relationship.
The A/D Line Formula
The A/D line calculation involves three steps: computing the Close Location Value (CLV), calculating the Money Flow Volume, and adding it to the cumulative A/D total.
Step 1: Close Location Value (CLV)
CLV = ((Close - Low) - (High - Close)) / (High - Low)The CLV measures where the close falls within the session's range. This is the key innovation of the A/D line. Rather than treating volume as entirely bullish or entirely bearish (as OBV does), the CLV proportionally allocates volume based on the close's position.
Step 2: Money Flow Volume
Money Flow Volume = CLV × VolumeStep 3: Cumulative A/D Line
A/D Line = Previous A/D Line Value + Current Money Flow VolumeThe A/D line is cumulative, meaning each day's Money Flow Volume is added to a running total. The absolute value of the A/D line is not meaningful — what matters is the direction and trend of the line.
Pro Tip
Interpreting the A/D Line
Rising A/D Line
A rising A/D line indicates that the majority of volume is associated with upward price movement. Closes are consistently in the upper half of the daily range, signaling accumulation. This is bullish because it shows that money is flowing into the security.
Falling A/D Line
A falling A/D line shows that volume is associated with downward price movement. Closes are consistently in the lower half of the daily range, signaling distribution. This is bearish because money is flowing out of the security.
Flat A/D Line
A flat A/D line indicates balanced buying and selling pressure. Volume is equally divided between accumulation and distribution, suggesting the market is in equilibrium. This often occurs during consolidation phases.
Divergence: The Most Powerful Signal
Divergence between the A/D line and price is the indicator's most valuable application. Divergence occurs when price and the A/D line move in opposite directions, suggesting that the visible price trend is not supported by underlying money flow.
Bullish Divergence
Price makes lower lows while the A/D line makes higher lows (or at least fails to make new lows). This signals that despite the declining price, money is actually flowing into the security — accumulation is occurring beneath the surface.
Bullish divergence often precedes significant price reversals because it reveals that informed buyers are accumulating shares at lower prices while the broader market remains bearish. This is classic "smart money" behavior.
Bearish Divergence
Price makes higher highs while the A/D line makes lower highs (or fails to make new highs). This warns that despite rising prices, money is flowing out of the security — distribution is occurring.
Bearish divergence often precedes market tops because it reveals that informed sellers are distributing shares into the rally while retail traders are still buying. The price advance is not supported by genuine accumulation.
| Divergence Type | Price Action | A/D Line Action | Signal | Reliability |
|---|---|---|---|---|
| Bullish | Lower lows | Higher lows | Buy/Accumulation | High |
| Bearish | Higher highs | Lower highs | Sell/Distribution | High |
| None | Aligned with A/D | Aligned with price | Trend confirmation | Informational |
A/D Line vs. On-Balance Volume (OBV)
Both the A/D line and OBV are cumulative volume indicators, but they differ in a fundamental way.
How OBV Works
OBV adds the entire day's volume to its running total on up days and subtracts the entire day's volume on down days. It uses a binary approach: every share traded is classified as either buying or selling volume based solely on whether the close was higher or lower than the prior close.
How the A/D Line Differs
The A/D line uses the CLV multiplier to proportionally allocate volume. A day with a close slightly above the midpoint of the range assigns only a small portion of volume as accumulation, while OBV would assign all of it.
| Feature | A/D Line | OBV |
|---|---|---|
| Volume allocation | Proportional (CLV-weighted) | Binary (all or nothing) |
| Reference point | Close within today's range | Close vs. prior close |
| Sensitivity | More nuanced | More responsive |
| Gap handling | Ignores gaps (intra-day focus) | Affected by gaps |
| Best for | Smart money tracking | Overall volume trend |
When Each Is Better
The A/D line is generally superior for detecting smart money accumulation and distribution because its proportional approach captures the nuance of intra-session price action. OBV is simpler and more responsive, making it better for quick trend confirmation and detecting volume surges.
Many traders use both indicators together. When OBV and the A/D line both diverge from price in the same direction, the signal is particularly strong.
Pro Tip
Practical Applications
Confirming Breakouts
When a stock breaks out from a chart pattern like an ascending triangle or cup and handle, check the A/D line. A breakout accompanied by a rising A/D line is more likely to succeed because it shows genuine accumulation driving the move. A breakout with a flat or falling A/D line is suspicious.
Confirming Trend Health
During an uptrend, the A/D line should be rising along with price. If the uptrend continues but the A/D line begins to flatten or decline, the trend may be losing its foundation. This early warning can help you tighten stops or reduce position size before a visible price reversal occurs.
Identifying Bottoming Patterns
During a rounding bottom or double bottom, the A/D line often begins rising while price is still basing. This early accumulation signal can help you identify reversal candidates before they break out.
Screening for Institutional Activity
Stocks with strongly rising A/D lines while price consolidates sideways are potential breakout candidates. The rising A/D suggests institutional accumulation — smart money building positions before a potential catalyst or breakout.
Limitations of the A/D Line
Does not account for gaps. The A/D line only considers the close's position within the current day's high-low range. It ignores the gap between the prior close and current open, which can carry significant information.
Volume data quality. The A/D line requires accurate volume data. In markets with fragmented volume (like US equities across multiple exchanges and dark pools), the volume data may not capture the full picture.
Cumulative nature. The starting value is arbitrary, and the cumulative nature means that a long history of accumulation or distribution can dominate recent signals. There is no "overbought" or "oversold" level for the A/D line.
Thin stocks. In thinly traded securities, a single large transaction can skew the A/D line significantly. The indicator works best on liquid, widely traded securities.
Combining with Other Indicators
Moving averages. Apply a moving average to the A/D line itself (such as a 20-day or 50-day MA) to smooth out noise and identify the A/D trend more clearly.
RSI. Use RSI for momentum analysis alongside the A/D line for volume analysis. RSI divergence combined with A/D divergence provides one of the strongest reversal signals available.
Chaikin Money Flow. The CMF is a bounded version of the A/D concept that makes it easier to identify overbought/oversold volume conditions.
Bollinger Bands. Combine Bollinger Band squeeze patterns with A/D line trends to identify the likely breakout direction.
Frequently Asked Questions
What does a rising A/D line with falling price mean?
A rising A/D line while price declines is a bullish divergence — the most powerful signal the A/D line produces. It indicates that despite the visible price decline, money is flowing into the security (accumulation). Informed buyers are acquiring shares at lower prices, and the price decline is likely to reverse.
How is the A/D line different from Chaikin Money Flow?
The A/D line is a cumulative, unbounded indicator — its value continues growing or shrinking indefinitely. Chaikin Money Flow applies the same CLV concept but over a fixed period (typically 21 days), producing a bounded oscillator that fluctuates between -1 and +1. CMF is easier to read for overbought/oversold conditions, while the A/D line is better for long-term trend analysis.
Can the A/D line be used for day trading?
Yes, the A/D line can be applied to intraday charts. On intraday timeframes, it helps identify whether volume is flowing into or out of a security during the session. However, intraday A/D signals are noisier and less reliable than daily or weekly signals.
What timeframe works best for the A/D line?
The daily chart is the most popular timeframe for A/D line analysis. Weekly charts provide longer-term perspective on institutional accumulation and distribution cycles. The indicator is less useful on very short timeframes (1-minute, 5-minute) due to noise.
Should the A/D line be my primary indicator?
The A/D line is best used as a confirmation tool rather than a primary trading signal. Combine it with price pattern analysis, trend indicators like moving averages, and momentum oscillators like RSI or MACD for a comprehensive trading approach.
How do I know if divergence is significant?
Significant divergence develops over multiple weeks or longer and involves clear, visible separation between the price trend and A/D trend. Brief, shallow divergences on daily charts are common and often resolve without producing reversals. The longer and more pronounced the divergence, the more reliable the signal.
Disclaimer
This is educational content, not financial advice. Trading involves risk, and you should consult a qualified financial advisor before making any investment decisions. Past performance does not guarantee future results.
12 chapters covering charts, indicators, risk management & more. Plus weekly trading insights.