Rounding Bottom (Saucer): Long-Term Reversal Pattern
⚡ Key Takeaways
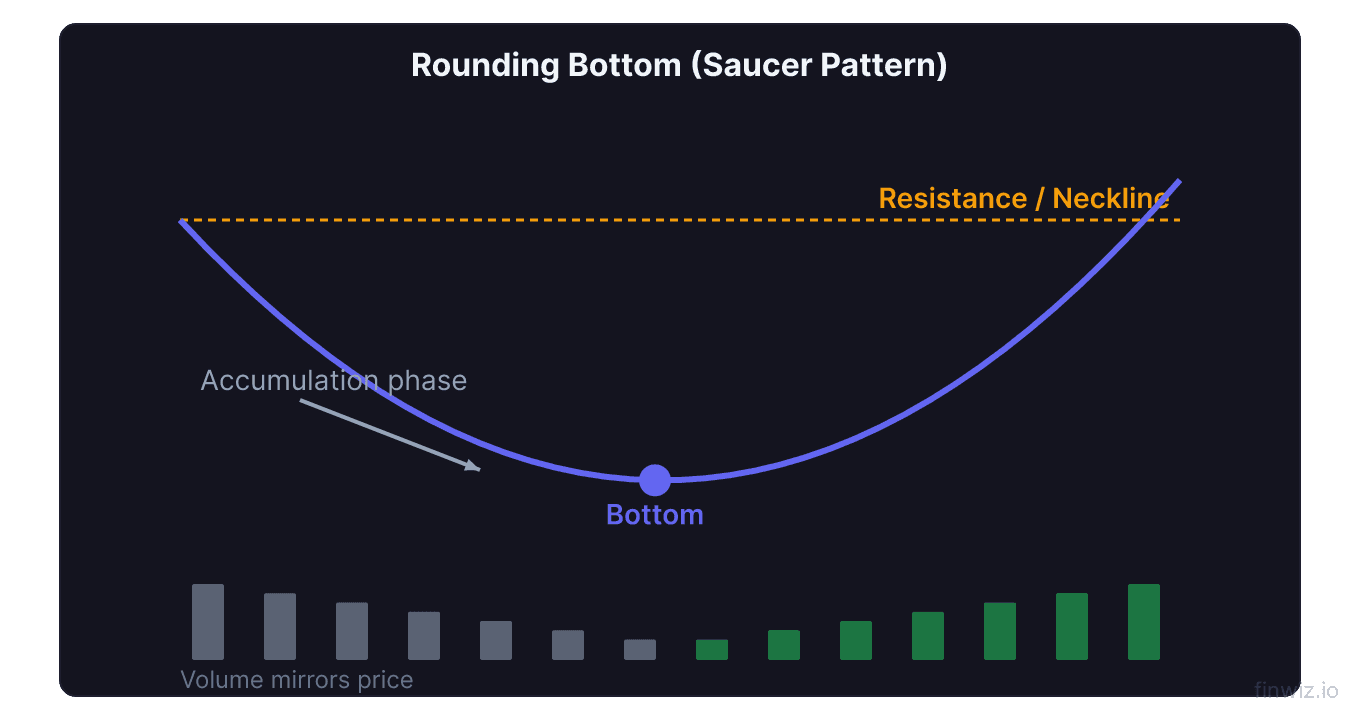
- The rounding bottom (saucer pattern) is a long-term bullish reversal formation characterized by a gradual, U-shaped transition from downtrend to uptrend.
- Unlike sharp V-bottom reversals, the rounding bottom shows a slow shift in sentiment where selling pressure gradually fades and buying interest incrementally builds.
- The pattern typically takes weeks to months to complete on daily charts, making it one of the longer-forming reversal patterns in technical analysis.
- Volume forms a characteristic U-shape that mirrors the price pattern — heavy during the decline, quiet at the bottom, and increasing during the recovery.
- Confirmation occurs when price breaks above the neckline (the resistance level connecting the pattern
What Is a Rounding Bottom?
The rounding bottom, also known as the saucer pattern or bowl pattern, is a bullish reversal formation that appears on charts as a gradual, curved transition from a declining price trend to a rising price trend. The shape resembles the bottom of a bowl or saucer when viewed from the side.
This pattern is distinct from more aggressive reversal formations like double bottoms or head and shoulders bottoms because it reflects a slow, organic shift in market sentiment. There is no dramatic capitulation event or sudden buying surge. Instead, selling pressure gradually fades over time while buying interest slowly builds, creating a smooth curvature on the chart.
The rounding bottom is found most commonly on weekly and monthly charts of individual stocks, sector ETFs, and commodities. It is a favorite pattern among position traders and investors who are willing to hold for extended periods to capture the full upside that typically follows the pattern's completion.
Anatomy of the Rounding Bottom
The Decline Phase (Left Side of the Saucer)
The pattern begins with a gradual decline from a prior high. This decline does not need to be steep — in fact, a gentle, grinding decline is characteristic. During this phase:
- Selling pressure is moderate but persistent
- Each rally attempt is slightly weaker than the last
- Volume is relatively high but declining as the stock loses popularity
- Bearish sentiment prevails, and the asset falls out of favor with most traders
The Bottom Phase (Base of the Saucer)
The base of the rounding bottom is where the transition occurs. Price action flattens as selling pressure equilibrates with buying interest. Key characteristics:
- Price trades in a narrow, relatively flat range
- Volume drops to its lowest levels in the pattern — the asset is being ignored
- Volatility contracts significantly
- The flat period can last weeks or even months
This quiet base is the most important phase of the pattern. It represents the exhaustion of sellers and the beginning of quiet accumulation by informed buyers. Wyckoff method practitioners would recognize this as an accumulation phase where "smart money" begins building positions.
The Rise Phase (Right Side of the Saucer)
The right side of the saucer mirrors the left side as price begins a gradual recovery:
- Buying pressure incrementally increases
- Each pullback during the recovery is shallower than the last
- Volume begins increasing as the asset regains attention
- Bullish sentiment slowly returns
The rise should be roughly symmetrical with the decline in both time duration and angle. A pattern where the decline took 12 weeks ideally shows a recovery of approximately 10-14 weeks.
Pro Tip
The Neckline and Breakout
Defining the Neckline
The neckline is the horizontal resistance level drawn at the price where the rounding bottom began (the left side high) and where the right side recovery approaches. This level represents the price at which the prior decline started, and it acts as resistance.
Breakout Confirmation
The pattern confirms when price closes above the neckline on increased volume. This breakout signifies that the entire decline-and-recovery cycle is complete, and a new uptrend has begun.
Measured Move Target
Rounding Bottom Target = Neckline Level + (Neckline Level - Pattern Low)The measured move target projects the depth of the saucer above the neckline. In practice, rounding bottom breakouts frequently exceed this target because the extended accumulation at the base builds a strong foundation for a sustained advance.
Volume Profile: The U-Shape
Volume behavior during a rounding bottom creates its own saucer shape that mirrors the price pattern.
| Phase | Volume Level | Interpretation |
|---|---|---|
| Early decline | High | Active selling, bearish sentiment |
| Mid-decline | Declining | Selling pressure fading |
| Bottom/Base | Lowest | Apathy, asset ignored, quiet accumulation |
| Early recovery | Increasing | Buyers returning, interest building |
| Late recovery | High | Growing conviction, momentum building |
| Breakout | Surge | Confirmation, broad participation |
This U-shaped volume pattern is one of the most important validation criteria. A rounding bottom with flat or erratic volume throughout its formation is less reliable than one with the characteristic volume decline and recovery.
Monitor On-Balance Volume during the pattern formation. OBV should begin trending upward during the base or early recovery phase, even before the price pattern is obvious. This OBV divergence (rising OBV while price is flat or barely rising) signals accumulation.
Rounding Bottom vs. Other Reversal Patterns
| Pattern | Formation Speed | Visual Shape | Volume Pattern | Typical Duration |
|---|---|---|---|---|
| Rounding Bottom | Very slow | U-shaped curve | U-shaped | Weeks to months |
| Double Bottom | Moderate | W-shape | Spike at bottoms | Days to weeks |
| Triple Bottom | Moderate-slow | Three distinct lows | Declining on tests | Weeks |
| Head & Shoulders Bottom | Moderate | Three troughs, middle deepest | Spike on breakout | Days to weeks |
| V-Bottom | Very fast | Sharp V-shape | Heavy at bottom | Days |
The rounding bottom stands apart because of its gradual nature. While other patterns feature distinct price pivots, the rounding bottom flows smoothly without sharp turning points. This makes it harder to trade using standard breakout triggers, but the resulting trends tend to be longer-lasting.
Trading the Rounding Bottom
Identification and Preparation
- Scan for candidates: Look for stocks in prolonged basing patterns with declining volume
- Draw the saucer: Visually confirm the U-shape in both price and volume
- Identify the neckline: Mark the resistance level where the decline began
- Monitor approach: Watch as the right side of the saucer approaches the neckline
Entry Strategies
Breakout entry. Buy on a close above the neckline with above-average volume. This is the most conservative and widely used entry.
Early entry. Enter during the right side of the saucer when the recovery pattern becomes clear and moving average crossovers (such as the 20-day crossing above the 50-day) confirm the trend change. This entry captures more of the move but involves more risk since the pattern is not yet confirmed.
Retest entry. After the neckline break, price often pulls back to retest the neckline as support. Entering on this retest offers the best risk-reward ratio, with the stop placed just below the neckline.
Stop Loss Placement
Conservative stop: Below the lowest point of the saucer (the base). This gives the trade maximum room but results in a wide stop.
Moderate stop: Below the most recent swing low on the right side of the saucer, typically within the final third of the recovery phase.
Aggressive stop (post-breakout): Below the neckline level. If the breakout fails and price falls back below the neckline, the pattern's validity is questionable.
Position Management
Given the rounding bottom's long-term nature, consider a scaled entry approach:
- Enter one-third of the position during the right side of the saucer
- Add one-third on the neckline breakout
- Add the final third on a successful retest of the neckline
This scaled approach reduces risk if the pattern fails while maximizing position size if it succeeds.
Pro Tip
Rounding Bottom Variations
Rounding Bottom with Handle
Similar to the cup and handle pattern, a rounding bottom sometimes develops a short pullback (handle) just before or after the neckline break. The handle is a brief consolidation that allows the most nervous holders to exit before the next advance. A breakout from the handle provides an additional entry point with a tighter stop loss.
Partial Rounding Bottom
Sometimes the right side of the saucer is steeper than the left side, creating an asymmetric pattern. This can occur when a catalyst (earnings surprise, sector rotation, market rally) accelerates the recovery. Asymmetric rounding bottoms are still valid, though the ideal pattern shows symmetry.
Multiple Saucers
In strongly accumulating assets, you may see nested rounding bottoms — a smaller saucer within a larger saucer pattern. The completion of the smaller pattern often triggers the acceleration phase of the larger pattern.
Combining with Indicators
Moving average alignment. Watch for the 50-day moving average to cross above the 200-day (golden cross) during the right side of the saucer. This moving average crossover often coincides with the pattern's breakout, providing strong confirmation.
RSI trajectory. The RSI should show a gradual recovery from oversold territory during the base, trending upward during the right side. An RSI above 50 at the time of the neckline break adds confirmation.
MACD signal. A MACD bullish crossover above the zero line during the right side of the saucer validates the momentum shift.
Accumulation/Distribution. The A/D line should show accumulation (rising) during the base and recovery phases, even before the price breakout confirms.
Common Mistakes
Impatience. The rounding bottom takes a long time to form. Traders who enter too early during the base phase may endure weeks of flat price action that tests their patience.
Ignoring volume. A rounding bottom without the characteristic U-shaped volume pattern is less reliable. Always verify the volume profile.
Using on short timeframes. Rounding bottoms on 5-minute or even hourly charts are generally noise. This pattern is most meaningful on daily, weekly, and monthly charts.
Tight stops on a wide pattern. Given the pattern's extended nature, stops that are too tight will be triggered by normal volatility. Use the pattern's structure (not arbitrary dollar amounts) for stop placement.
Frequently Asked Questions
How long does a rounding bottom take to form?
On daily charts, rounding bottoms typically take 6 weeks to 6 months to form. On weekly charts, they may span months to over a year. The longer the formation period, the more significant the eventual breakout tends to be, as more accumulation has occurred at the base.
Is the rounding bottom rare?
The textbook rounding bottom is relatively uncommon compared to patterns like double bottoms or triangles. Its gradual nature and long formation time make it less frequent, but the patterns that do form tend to be highly reliable.
Can there be a rounding top pattern?
Yes, the rounding top (inverse saucer) is the bearish mirror image of the rounding bottom. Price gradually transitions from an uptrend to a downtrend through a smooth, inverted U-shape. It is even rarer than the rounding bottom because tops tend to be sharper than bottoms (fear moves markets faster than greed).
What sectors commonly produce rounding bottoms?
Rounding bottoms are especially common in cyclical sectors like materials, industrials, and energy, where long economic cycles create extended basing periods. Technology stocks undergoing business transformations and biotech stocks awaiting catalysts also frequently exhibit this pattern.
How does the rounding bottom differ from the cup and handle?
The cup and handle includes a distinct handle — a short pullback after the right side of the cup reaches the neckline. The rounding bottom may or may not develop a handle. Additionally, the cup and handle is often discussed as a continuation pattern within a broader uptrend, while the rounding bottom is primarily a reversal pattern from a downtrend.
What is the success rate of the rounding bottom?
The rounding bottom has a reported success rate of approximately 65-75% for reaching its measured move target when confirmed with a volume breakout above the neckline. Its success rate is among the highest of reversal patterns because the extended accumulation phase creates a solid foundation for the subsequent advance.
Disclaimer
This is educational content, not financial advice. Trading involves risk, and you should consult a qualified financial advisor before making any investment decisions. Past performance does not guarantee future results.
Related Articles
12 chapters covering charts, indicators, risk management & more. Plus weekly trading insights.