Symmetrical Triangle: Breakout Direction & Trading Rules
⚡ Key Takeaways
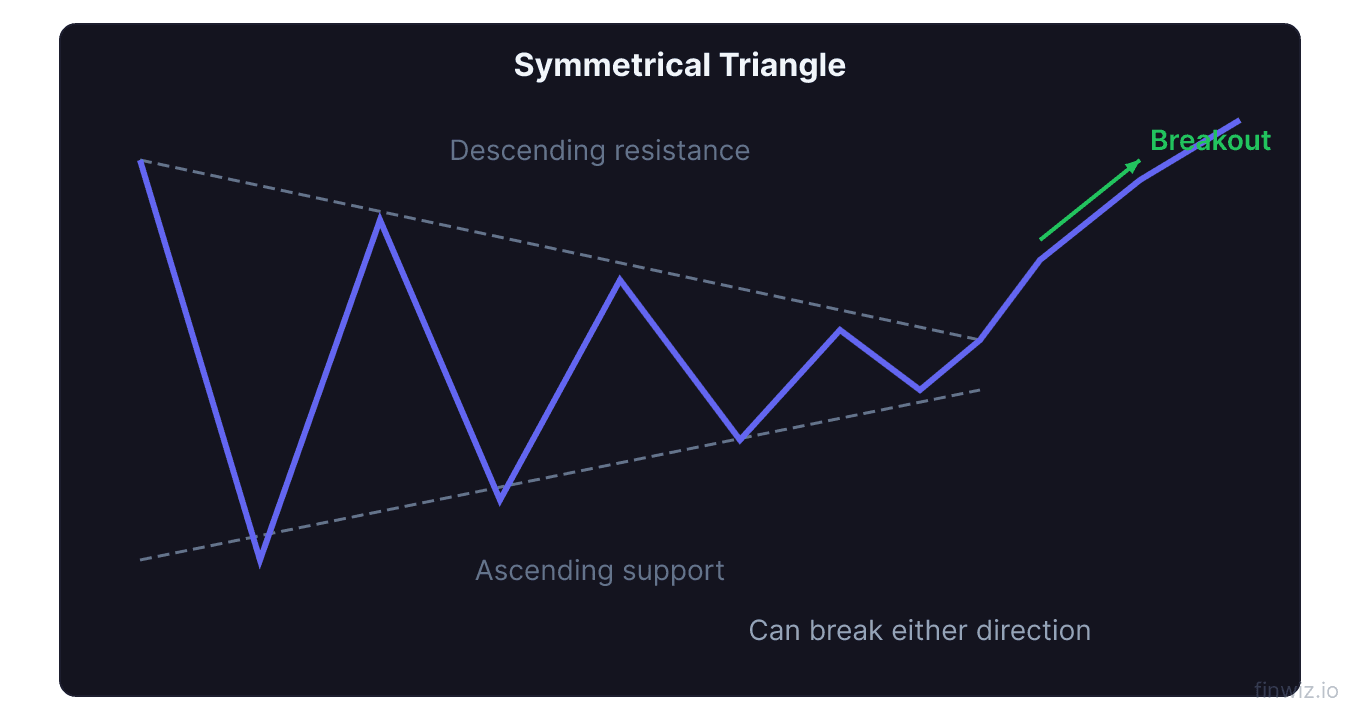
- A symmetrical triangle forms when price makes lower highs and higher lows, creating converging trendlines that compress the trading range.
- The pattern is neutral and can break in either direction, though it often continues the prevailing trend when appearing as a mid-trend consolidation.
- Breakouts typically occur within the final third of the triangle, between 50% and 75% of the way to the apex.
- Volume should decline during the triangle formation and expand significantly on the breakout to confirm the directional move.
- The measured move target equals the height of the triangle at its widest point, projected from the breakout level.
What Is a Symmetrical Triangle?
The symmetrical triangle is a chart pattern characterized by two converging trendlines: a descending upper trendline connecting lower highs and a rising lower trendline connecting higher lows. As these lines converge, the price range compresses into an increasingly tight formation that eventually resolves with a breakout in one direction.
Unlike the ascending triangle (bullish) or descending triangle (bearish), the symmetrical triangle is considered a neutral pattern because neither buyers nor sellers hold a structural advantage within the formation. Both sides are making concessions: buyers accept lower highs while sellers accept higher lows. This mutual compression creates a coiled-spring effect that releases when one side finally overpowers the other.
The symmetrical triangle can function as either a continuation pattern (breaking in the direction of the prior trend) or a reversal pattern (breaking against the prior trend). In practice, it resolves in the direction of the prior trend roughly 55-60% of the time, giving it a slight continuation bias, but the margin is not large enough to trade directionally before the breakout occurs.
Structure of the Symmetrical Triangle
Identifying a valid symmetrical triangle requires verifying several structural elements.
Converging Trendlines
The two trendlines must converge at roughly equal angles. If one trendline is significantly steeper than the other, the pattern may be a rising wedge, falling wedge, ascending triangle, or descending triangle rather than a symmetrical triangle. The symmetry of the angles is what distinguishes this pattern.
Each trendline should have at least two touches, though three or more provide greater reliability. The alternating bounces between the upper and lower trendlines create the zigzag pattern within the triangle that visually represents the tightening battle.
Price Behavior Within the Triangle
Price should oscillate between the two trendlines, touching or nearly touching each line before reversing. Each successive swing should have a smaller range than the previous one, reflecting the compression of the trading range as the triangle narrows.
The most important internal behavior to watch is whether the swings are orderly and symmetrical. Erratic or uneven price action within the triangle may indicate that the formation is not a clean symmetrical triangle and may produce a less reliable breakout.
The Apex
The apex is where the two trendlines would theoretically meet. Price should break out of the triangle well before reaching the apex, typically between 50% and 75% of the distance from the triangle's origin to the apex. Breakouts that occur too close to the apex often lack momentum, while breakouts too early may not have built sufficient compression.
Pro Tip
Volume Characteristics
Volume behavior within and around the symmetrical triangle provides essential trading clues.
During formation: Volume should decline progressively as the triangle develops. Each swing within the triangle should produce lower volume than the previous swing. This declining volume reflects the narrowing price range and the diminishing activity as traders wait for a resolution.
On the breakout: Volume should expand sharply when price exits the triangle. A breakout on volume 50-100% above the recent average provides strong confirmation. High-volume breakouts are far more likely to follow through than low-volume ones.
Volume bias as a clue: While the overall trend is declining volume, subtle differences between up-swings and down-swings can provide early clues. If volume is consistently higher on up-swings than down-swings within the triangle, it suggests bullish pressure is building, hinting at an eventual upside breakout. The reverse is true for a bearish bias.
Post-breakout volume: Volume should remain elevated during the first few sessions after the breakout. Declining volume immediately after the breakout is a warning sign of a potential false move.
Trading the Symmetrical Triangle
Because the symmetrical triangle is directionally neutral, the trading strategy focuses on reacting to the breakout rather than predicting it.
Entry Strategy
Breakout entry: Wait for a candle to close outside the triangle on strong volume. Enter in the direction of the breakout. For an upside breakout, buy on the close or the next session's open. For a downside breakout, sell short on the close or the next session's open.
Retest entry: After the breakout, price frequently retests the broken trendline. For an upside breakout, the upper trendline (formerly resistance) becomes support and can be bought on the pullback. For a downside breakout, the lower trendline (formerly support) becomes resistance and can be shorted on the bounce.
Stop Loss
For upside breakouts: Place the stop below the most recent swing low within the triangle, or below the lower trendline at the point of breakout.
For downside breakouts: Place the stop above the most recent swing high within the triangle, or above the upper trendline at the point of breakout.
Price Target
Price Target = Breakout Price +/- Triangle Height (at widest point)Measure the vertical distance at the widest part of the triangle (from the first high to the first low). Add this to the breakout price for upside targets or subtract it for downside targets.
| Entry Method | Pros | Cons |
|---|---|---|
| Breakout | Confirmed direction | May miss initial move |
| Retest | Better price, tighter stop | Not all breakouts retest |
| Pre-breakout (at trendline) | Best price | No directional confirmation |
Symmetrical Triangle vs. Other Patterns
Understanding the differences between the symmetrical triangle and related patterns prevents misidentification.
vs. Ascending Triangle
The ascending triangle has a flat upper boundary, while the symmetrical triangle has a descending upper boundary. The ascending triangle is bullish; the symmetrical triangle is neutral.
vs. Descending Triangle
The descending triangle has a flat lower boundary, while the symmetrical triangle has a rising lower boundary. The descending triangle is bearish; the symmetrical triangle is neutral.
vs. Pennant
The pennant looks like a small symmetrical triangle but must be preceded by a sharp pole. The pennant is specifically a short-term continuation pattern, while the symmetrical triangle can be larger, longer, and can break in either direction. If there is no preceding pole, it is a symmetrical triangle. If a sharp pole precedes a small converging consolidation, it is a pennant.
vs. Wedge
Wedge patterns have both trendlines sloping in the same direction (both up or both down). The symmetrical triangle has one trendline sloping up and one sloping down. Wedges carry directional bias opposite to their slope, while symmetrical triangles are neutral.
Failed Symmetrical Triangles
Symmetrical triangles can produce false breakouts that reverse back into the pattern. Understanding these failures is essential for risk management.
A false breakout occurs when price closes outside the triangle but then reverses and moves back within the pattern. This can happen in either direction and often traps traders on the wrong side. The subsequent move in the opposite direction (the true breakout) can be powerful because of the added momentum from trapped traders exiting.
Signs of a potential false breakout include: very low volume on the breakout, a breakout that occurs very close to the apex (low momentum), and a breakout that occurs against the broader market trend.
How to protect against false breakouts: Use volume confirmation as a filter (only act on high-volume breakouts), wait for a close outside the triangle rather than acting on an intraday breach, and always use a stop loss inside the triangle that limits your loss if the breakout reverses.
Pro Tip
Symmetrical Triangles in Different Timeframes
The pattern's reliability and implications vary significantly by timeframe.
Monthly and weekly charts produce the most significant symmetrical triangles. These large-scale patterns represent months or years of consolidation and can produce breakout moves of 20-50% or more. They are favorites of position traders and long-term investors.
Daily charts are the most commonly traded timeframe for symmetrical triangles. Patterns that take 3-12 weeks to form on the daily chart provide good trading opportunities with clearly defined risk levels.
Intraday charts produce symmetrical triangles frequently, but they are less reliable. Day traders can trade intraday symmetrical triangles, particularly during the first two hours of the session, but should use tighter targets and be prepared for more frequent false breakouts.
Combining with Other Analysis
Strengthen your symmetrical triangle analysis with complementary tools.
Trend analysis: Identify the trend that preceded the triangle. If the stock was in an uptrend, give slight preference to upside breakouts. If in a downtrend, lean toward downside breakouts. Use moving averages to define the trend.
RSI analysis: If the RSI is gradually rising within the triangle (making higher lows), it suggests building bullish momentum despite the neutral price pattern. If the RSI is declining, bearish momentum may be building.
MACD signals: A MACD crossover near the apex of the triangle can provide early warning of the breakout direction. A bullish MACD crossover favors an upside breakout; a bearish crossover favors a downside breakout.
Support and resistance: Identify major support and resistance levels near the triangle's boundaries. If the triangle forms just below a major resistance level, an upside breakout has additional significance. If it forms just above major support, a downside breakout could trigger accelerated selling.
Sector and market context: The direction of the broader market and the stock's sector can influence which way the triangle resolves. In a strong bull market, symmetrical triangles in leading stocks tend to break upward more frequently.
Trading Psychology of the Symmetrical Triangle
The symmetrical triangle is a test of patience and discipline.
During formation: The narrowing price range can be frustrating as the market chops back and forth without making progress. Inexperienced traders often try to predict the breakout direction and enter prematurely, only to be stopped out by the next swing within the triangle. The disciplined approach is to wait for the breakout.
At the breakout: When the breakout finally occurs, there is often a strong temptation to question whether it is real or a false move. This hesitation can cause traders to miss the entry. Having predetermined criteria (close outside the triangle on above-average volume) removes the emotional decision-making.
After the breakout: If the trade moves in your favor, the temptation is to take profits too quickly after the frustrating consolidation period. Let the measured move target guide your exit strategy. If the trade moves against you (a false breakout), accept the loss promptly and re-evaluate.
Developing a systematic approach to symmetrical triangles, with clear entry rules, stop levels, and targets, helps manage the psychological challenges inherent in trading a neutral pattern.
Frequently Asked Questions
Which direction do symmetrical triangles usually break?
Symmetrical triangles break in the direction of the prior trend approximately 55-60% of the time, giving them a slight continuation bias. However, this margin is not large enough to trade directionally before the breakout occurs. The safest approach is to wait for the breakout to confirm the direction and then enter accordingly. Volume on the breakout is the best indicator of whether the move is genuine, regardless of direction.
How long do symmetrical triangles take to form?
On a daily chart, symmetrical triangles typically take 3 weeks to 3 months to form. Patterns that form in less than 2 weeks may not have sufficient data for reliable trendlines. Very long triangles (over 6 months on a daily chart) are significant but may test traders' patience. The breakout usually occurs between 50% and 75% of the way from the triangle's origin to the apex, which provides a rough timing estimate for when to expect the resolution.
What happens if the breakout occurs near the apex?
Breakouts near the apex (beyond 75% of the distance to the convergence point) tend to be weaker and less reliable. When price compresses too close to the apex, the remaining energy for a significant move diminishes. These late breakouts often produce small moves that quickly stall or reverse. The best breakouts occur in the 50-75% zone, where sufficient compression has built up but enough room remains for a meaningful move. If the triangle reaches the apex without a breakout, the pattern is generally considered invalidated.
Can I trade inside the symmetrical triangle?
Yes, some traders trade the swings within the triangle by buying at the lower trendline and selling at the upper trendline. This approach can be profitable in larger triangles with clear, orderly swings, but it carries the risk of being caught on the wrong side of a breakout. If you trade inside the triangle, use tight stops and take quick profits. Be prepared to reverse your position if a breakout occurs while you are positioned against the breakout direction. Most experienced traders prefer to wait for the breakout rather than trading inside the pattern.
Disclaimer
This is educational content, not financial advice. Trading involves risk, and you should consult a qualified financial advisor before making any investment decisions. Past performance does not guarantee future results.
12 chapters covering charts, indicators, risk management & more. Plus weekly trading insights.