Bear Flag Pattern: How to Trade Bearish Continuations
⚡ Key Takeaways
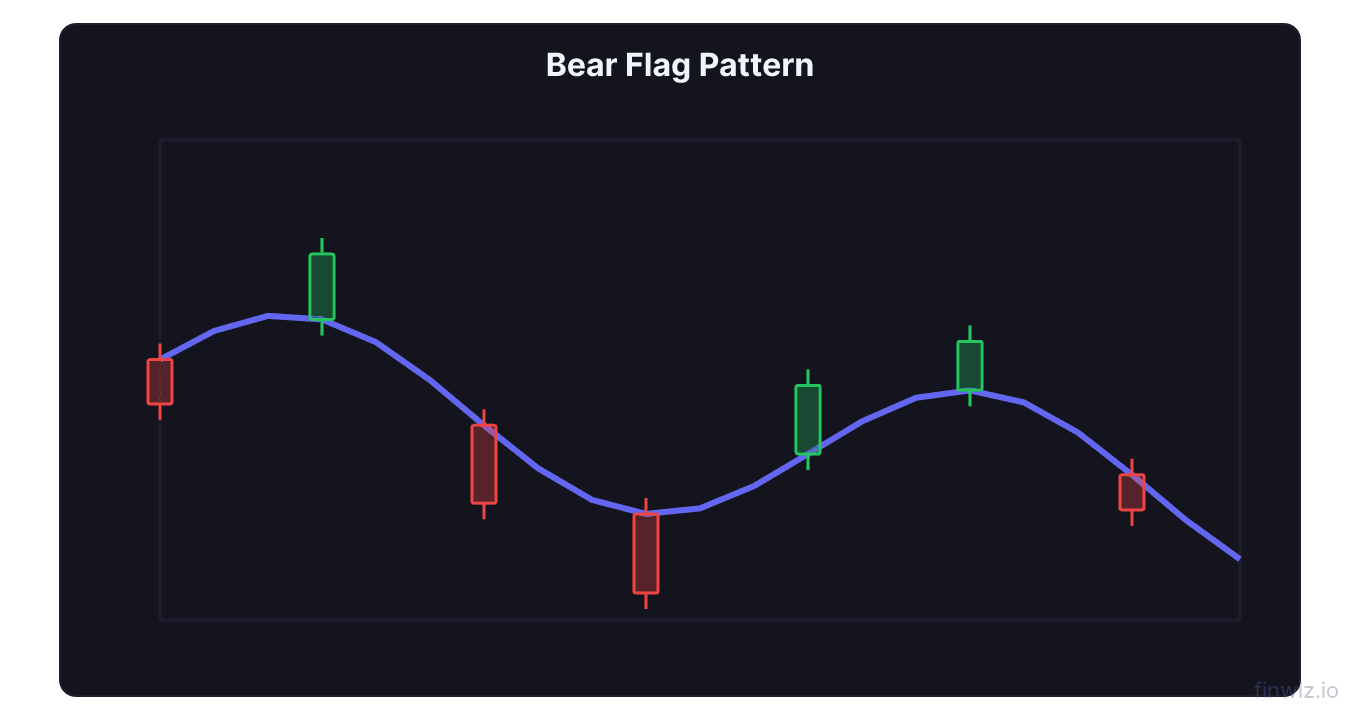
- The bear flag is a bearish continuation pattern consisting of a sharp decline (the flagpole) followed by a weak upward consolidation (the flag) that slopes against the prior trend.
- Volume typically declines during the flag formation and expands on the breakdown below flag support, confirming the pattern.
- The entry trigger is a close below the lower boundary of the flag channel, ideally accompanied by a surge in volume.
- The price target is calculated by projecting the flagpole's length downward from the breakdown point.
- The bear flag is the bearish mirror image of the bull flag, and both are among the most reliable continuation patterns in technical analysis.
What Is a Bear Flag Pattern?
The bear flag is a bearish continuation pattern that signals a likely resumption of a downtrend after a brief consolidation period. It forms when a stock experiences a sharp decline (the flagpole), pauses to consolidate in a slight upward or sideways channel (the flag), and then breaks down to continue the decline.
The pattern earns its name because the consolidation phase, when drawn on a chart, resembles a flag hanging from a pole. In the bear flag, the pole points downward and the flag tilts slightly upward — a weak countertrend bounce that lacks conviction. This upward drift during the flag represents short-covering and minor buying interest, but not enough demand to reverse the dominant bearish trend.
Bear flags are favored by short sellers and bearish traders because they offer clearly defined entry points, stop loss levels, and profit targets. The pattern works across all timeframes — from 5-minute intraday charts used by day traders to daily and weekly charts used by swing traders.
Anatomy of the Bear Flag
Understanding each component of the bear flag helps you identify the pattern accurately and avoid false signals.
The Flagpole
The flagpole is the initial sharp decline that precedes the consolidation. It should be a strong, impulsive move lower — not a gradual drift. The flagpole typically forms over a short period relative to the flag and is characterized by large bearish candles with above-average volume.
The strength and velocity of the flagpole matter. A steep, aggressive decline indicates strong selling pressure and makes the subsequent flag formation more reliable. A slow, grinding decline is less likely to produce a valid bear flag.
The Flag
The flag is the consolidation phase that follows the flagpole. It takes the form of a slight upward-sloping channel or a sideways rectangle. The key characteristic is that the flag retraces only a small portion of the flagpole — typically between 20% and 50% of the flagpole's range.
The flag should contain at least two to three swing points to establish the upper and lower boundaries of the channel. The upper boundary acts as resistance, and the lower boundary acts as support. When support breaks, the pattern triggers.
A valid flag should be relatively compact in time compared to the flagpole. If the consolidation lasts too long or retraces too much of the flagpole, the pattern loses its reliability. A flag that retraces more than 50% of the flagpole may be forming a reversal rather than a continuation.
Volume Profile
Volume behavior is one of the most important confirmation factors in a bear flag.
- During the flagpole: Volume should be elevated. The sharp decline should occur on above-average volume, showing strong selling conviction.
- During the flag: Volume should decline progressively. The upward drift happens on diminishing volume, indicating that the countertrend move lacks participation and conviction.
- On the breakdown: Volume should expand again. A spike in volume on the break below flag support confirms that sellers have resumed control.
If volume does not decline during the flag or does not expand on the breakdown, treat the pattern with skepticism.
Pro Tip
How to Trade the Bear Flag
Entry
The standard entry for a bear flag trade is a short position initiated on a break below the flag's lower support line. You can use a sell stop order placed just below the lower trendline of the flag channel to automate the entry.
More aggressive traders may enter short near the upper boundary of the flag (flag resistance), anticipating the breakdown. This provides a better entry price and tighter stop loss, but carries higher risk because the flag could continue higher before breaking down — or could fail entirely.
Stop Loss Placement
Place your stop loss above the flag's upper boundary (flag resistance). This is the level where the bear flag thesis is invalidated. If price breaks above the flag's resistance, the pattern has failed, and the stock may be reversing rather than continuing lower.
For a tighter stop, some traders place the stop just above the most recent swing high within the flag. This reduces risk per trade but increases the chance of being stopped out by normal price fluctuation.
Price Target
The measured move target for a bear flag is calculated by taking the length of the flagpole and projecting it downward from the breakdown point.
Bear Flag Target = Breakdown Point - Flagpole LengthThis measured move target provides a reasonable profit objective, though price may exceed the target in strong downtrends or fall short in weaker ones. Many traders use partial exits — taking half the position off at the measured move target and trailing a stop on the remainder.
Bear Flag vs. Bull Flag
The bear flag and the bull flag are mirror images of each other. Both are continuation patterns, but they operate in opposite directions.
| Feature | Bear Flag | Bull Flag |
|---|---|---|
| Prior trend | Downtrend | Uptrend |
| Flagpole direction | Down | Up |
| Flag slope | Slight upward or sideways | Slight downward or sideways |
| Trigger | Break below flag support | Break above flag resistance |
| Target | Flagpole projected down | Flagpole projected up |
| Volume on flag | Declining | Declining |
| Volume on breakout | Expanding | Expanding |
The psychology is also mirrored. In a bull flag, the flag represents profit-taking after a sharp rally — a pause before buyers resume. In a bear flag, the flag represents short-covering and bargain-hunting after a sharp decline — a pause before sellers resume.
Bear Flag vs. Pennant
The bear flag and the pennant pattern are closely related. Both are bearish continuation patterns that follow a sharp decline. The difference is the shape of the consolidation.
A bear flag consolidates in a channel — parallel or near-parallel upper and lower boundaries that slope slightly upward.
A bear pennant consolidates in a converging triangle — the upper boundary slopes downward and the lower boundary slopes upward, creating a symmetrical triangle shape. The breakout mechanics and target calculations are identical.
In practice, many traders treat bear flags and bear pennants interchangeably because the trading implications are the same: declining volume during consolidation, a breakdown trigger, and a flagpole-measured target.
Real-World Considerations
Timeframe Selection
Bear flags appear on all timeframes, but their reliability varies. On daily and weekly charts, bear flags tend to produce more reliable signals because they reflect broader institutional selling pressure. On intraday charts (1-minute, 5-minute), bear flags form frequently but are more prone to false breakdowns due to market noise.
For swing trading, daily chart bear flags offer the best risk-reward. For day trading, 5-minute and 15-minute chart bear flags work well when they align with the intraday trend.
Where Bear Flags Form
Bear flags are most reliable when they form in the context of a broader downtrend — not as isolated events. If a stock is in a long-term uptrend and produces a single bear flag, the pattern is more likely to fail because the dominant trend favors the bulls.
Look for bear flags that form:
- Below the 200-day moving average
- After a break below key support levels
- During bear markets or sector-wide selloffs
- In stocks with deteriorating fundamentals
Common Failure Modes
Bear flags fail when price breaks above the flag's upper boundary instead of below the lower boundary. This failed bear flag can become a bullish signal, as it represents a bear trap — shorts are forced to cover, accelerating the upward move.
Signs that a bear flag may fail include:
- Rising volume during the flag (suggests real buying, not just short-covering)
- The flag retracing more than 61.8% of the flagpole
- Bullish divergence on RSI or MACD
- The flag forming at a major support level on a higher timeframe
Pro Tip
Combining Bear Flags with Other Analysis
Bear flags become more powerful when combined with other forms of analysis:
Moving averages. A bear flag forming below a declining 50-day moving average adds confluence. If the flag's upper boundary aligns with the moving average as resistance, the breakdown signal is strengthened.
Volume indicators. Use OBV or accumulation/distribution to confirm that the flag represents distribution rather than accumulation.
Fibonacci levels. If the flag retraces to a key Fibonacci level (such as the 38.2% or 50% retracement of the flagpole), the level provides additional resistance and increases the probability of a breakdown.
Sector context. Bear flags in individual stocks are more reliable when the broader sector is also declining. A bear flag in a tech stock during a sector-wide selloff carries more weight than one forming while the sector rallies.
Frequently Asked Questions
How reliable is the bear flag pattern?
The bear flag is considered one of the more reliable continuation patterns in technical analysis. Studies and backtests suggest success rates between 55% and 70%, depending on the timeframe and the strictness of the criteria used. Reliability improves when the pattern is confirmed by declining volume during the flag and expanding volume on the breakdown.
How long should the flag last relative to the flagpole?
The flag should generally last one-third to two-thirds the duration of the flagpole in terms of time. A flag that lasts too long loses its reliability as a continuation pattern because the balance between buyers and sellers may have shifted. Most bear flags on daily charts last between five and fifteen sessions.
Can I trade bear flags with options?
Yes. Buying put options or put debit spreads is a defined-risk way to trade bear flags. The advantage is that your maximum loss is limited to the premium paid, protecting you from a failed pattern. The disadvantage is that options require the move to happen within a specific timeframe, and elevated implied volatility can make puts expensive.
What is the difference between a bear flag and a descending channel?
A bear flag is a short-term consolidation within a larger move. A descending channel is a sustained trend structure. The key difference is duration and context. A bear flag typically lasts days to a few weeks and represents a pause. A descending channel can persist for months and represents the trend itself.
Should I wait for the breakdown candle to close before entering?
Waiting for a closing candle below flag support reduces the risk of a false breakdown. Intraday breaks below support often reverse by the close. More conservative traders wait for a daily close below the lower boundary. More aggressive traders enter on the intraday break with a tight stop above the flag.
Disclaimer
This is educational content, not financial advice. Trading involves risk, and you should consult a qualified financial advisor before making any investment decisions. Past performance does not guarantee future results.
Related Articles
12 chapters covering charts, indicators, risk management & more. Plus weekly trading insights.