VWAP: Volume Weighted Average Price — The Day Trader's Anchor
⚡ Key Takeaways
- VWAP (Volume Weighted Average Price) calculates the average price weighted by volume throughout the trading day, resetting each session
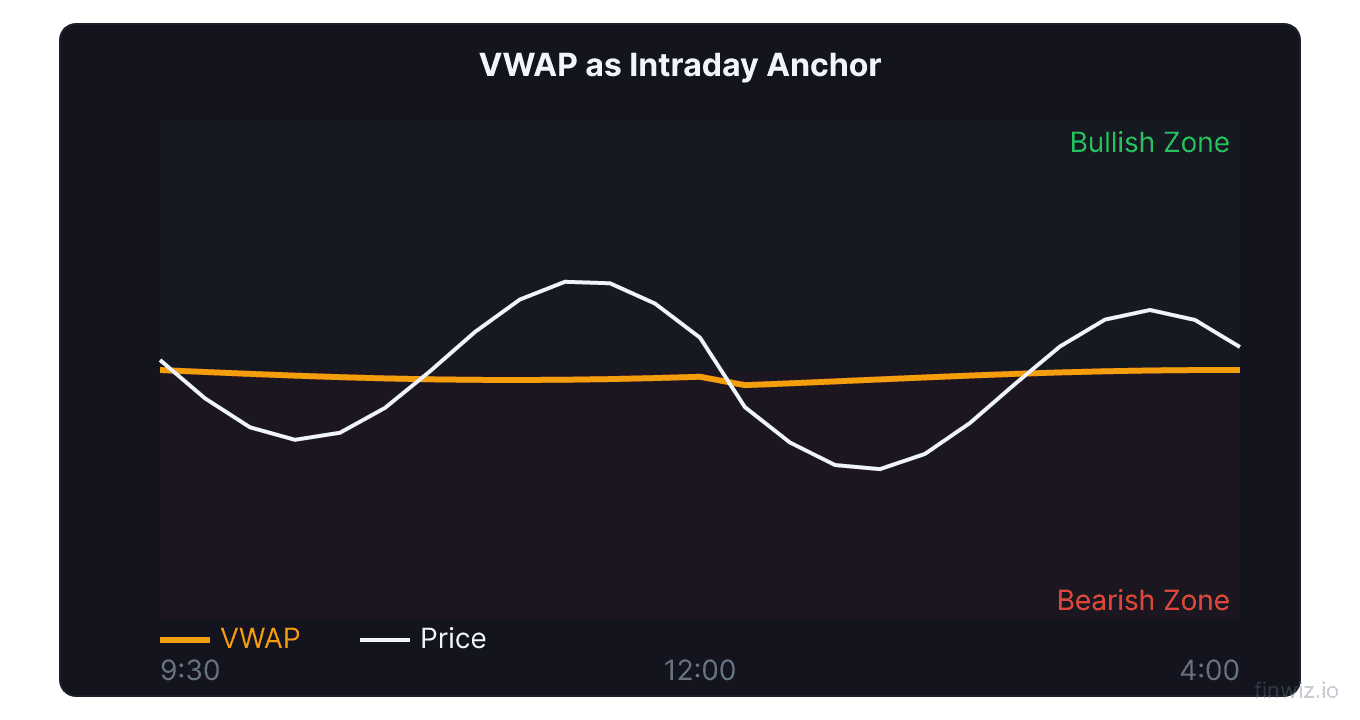
- Price above VWAP suggests bullish intraday sentiment; price below VWAP suggests bearish sentiment
- Institutional traders use VWAP as a benchmark — buying below VWAP and selling above is considered a good execution
- VWAP bands (standard deviations from VWAP) act as dynamic support and resistance levels throughout the day
- VWAP is most effective for intraday trading and loses relevance on daily or weekly charts since it resets each session
What Is VWAP?
Volume Weighted Average Price (VWAP) is a trading benchmark that represents the average price a security has traded at throughout the day, weighted by volume. Unlike a simple moving average that treats every price bar equally, VWAP gives more weight to price levels where the most trading activity occurred.
VWAP is plotted as a single line on the intraday chart and resets at the beginning of each trading session. It is considered the single most important indicator for day traders and is widely used by institutional traders to evaluate the quality of their trade executions.
The reason VWAP carries so much weight is straightforward: it tells you the true average price that market participants paid during the day. If you bought below VWAP, you got a better-than-average price. If you sold above VWAP, you achieved a better-than-average exit. This makes VWAP the anchor around which intraday price action revolves.
The VWAP Formula
Understanding the VWAP calculation helps you appreciate why this indicator behaves differently from simple moving averages.
VWAP = Cumulative (Typical Price x Volume) / Cumulative VolumeFor each period during the trading day, the typical price is calculated as the average of the high, low, and close. This typical price is then multiplied by the volume for that period. The running total of these values is divided by the cumulative volume up to that point.
Because VWAP is cumulative, it becomes increasingly stable as the trading day progresses. Early in the session, each new bar has a significant impact on the VWAP value. By the afternoon, it takes enormous volume to shift VWAP meaningfully. This characteristic is important for understanding how VWAP signals change throughout the day.
| Time of Day | VWAP Behavior | Trading Implication |
|---|---|---|
| First 30 minutes | Highly volatile, easily moved | Wait for VWAP to stabilize before trading |
| Mid-morning to midday | Stabilizing, more reliable | Best period for VWAP-based entries |
| Afternoon | Very stable, acts as magnet | Price tends to revert toward VWAP |
How Institutional Traders Use VWAP
Understanding institutional VWAP usage is critical because these large players drive market direction. Institutional traders use VWAP as their primary execution benchmark.
When a portfolio manager needs to buy one million shares of a stock, they instruct their execution desk to achieve a price at or below VWAP. This means institutions are systematic buyers when price dips below VWAP and systematic sellers when price rises above it. This behavior creates a self-fulfilling dynamic where VWAP acts as a gravitational center for price.
Knowing this, retail traders can align their strategies with institutional order flow. When price pulls back to VWAP in an uptrend, it often finds support because institutional buyers step in. When price rallies to VWAP in a downtrend, it often meets resistance because institutional sellers are waiting.
Pro Tip
VWAP as Support and Resistance
VWAP functions as a dynamic support and resistance level throughout the trading day. Unlike static support and resistance from historical price levels, VWAP moves with real-time volume and price data.
VWAP as support: In an uptrend, price often pulls back to VWAP and bounces. Traders look for bullish candlestick patterns or volume surges at VWAP to enter long positions. The logic is sound — institutional buyers are programmed to buy at or below VWAP, providing a floor of demand.
VWAP as resistance: In a downtrend, price often rallies to VWAP and reverses lower. Short sellers look for rejection candles or volume climaxes at VWAP to enter short positions. Institutional sell orders clustered around VWAP create a ceiling of supply.
VWAP cross: When price crosses above VWAP, it signals a shift from bearish to bullish intraday sentiment. When price crosses below VWAP, the opposite occurs. The most reliable VWAP crosses happen with above-average volume and occur after a period of consolidation near the VWAP level.
Combining VWAP with other support and resistance tools creates powerful confluence zones. When VWAP aligns with a previous day's high or low, a round number, or a Fibonacci retracement level, the resulting level is significantly stronger.
VWAP Bands and Standard Deviations
VWAP bands (also called VWAP standard deviation bands) extend the basic VWAP concept by adding bands at one, two, and three standard deviations above and below the VWAP line.
These bands serve several purposes. The first standard deviation bands contain approximately 68% of all price action during the day. The second standard deviation bands contain about 95%. Price reaching the second or third standard deviation band indicates an extreme move that is statistically likely to revert toward VWAP.
| Band Level | Distance from VWAP | Trading Application |
|---|---|---|
| +3 SD | Far above VWAP | Extreme overbought — high probability of reversion |
| +2 SD | Well above VWAP | Overbought — consider taking profits or shorting |
| +1 SD | Above VWAP | Mildly overbought — potential resistance |
| VWAP | Average price | Equilibrium — key support/resistance |
| -1 SD | Below VWAP | Mildly oversold — potential support |
| -2 SD | Well below VWAP | Oversold — consider buying |
| -3 SD | Far below VWAP | Extreme oversold — high probability of reversion |
Mean reversion strategies using VWAP bands are particularly effective in range-bound markets. When price reaches the second or third standard deviation, traders fade the extreme move with a target back toward VWAP. This approach works because the statistical properties of VWAP bands create a natural tendency for price to revert.
Pro Tip
VWAP Trading Strategies
Here are the most effective VWAP-based trading strategies used by professional day traders.
Strategy 1: VWAP Pullback Buy
Wait for a stock that opens strong and moves well above VWAP. Let price pull back toward VWAP. Enter long when price touches VWAP and shows a bullish reaction (a hammer candle, a bullish engulfing pattern, or a volume spike). Place your stop just below VWAP. Target the prior high or the upper VWAP band. This strategy exploits institutional buy orders clustered at VWAP.
Strategy 2: VWAP Fade at Extremes
When price reaches the second or third standard deviation VWAP band, look for signs of exhaustion — doji candles, declining volume, or a momentum indicator like RSI reaching an extreme. Enter a counter-trend trade targeting VWAP. This mean-reversion strategy has strong statistical backing but requires tight risk management because extreme moves can extend further.
Strategy 3: VWAP Cross Momentum
Enter in the direction of a VWAP cross when it occurs with strong volume. If price crosses above VWAP on a volume surge, go long with a stop below VWAP. If price crosses below VWAP with heavy volume, go short with a stop above VWAP. The volume confirmation is essential — VWAP crosses without volume frequently result in immediate reversals.
Strategy 4: VWAP and Opening Range
Combine VWAP with the opening range breakout strategy. If price breaks above the opening range high and is also above VWAP, the breakout has a higher probability of success. If price breaks below the opening range low and is below VWAP, the breakdown is more likely to follow through. VWAP adds a volume-weighted confirmation layer to the pure price breakout.
VWAP vs. Moving Averages
Traders sometimes wonder whether VWAP offers advantages over simple or exponential moving averages. The differences are significant.
VWAP incorporates volume into its calculation, while standard moving averages consider only price. This means VWAP reflects where actual trading occurred, not just where price happened to close. In liquid stocks with varying volume throughout the day, this distinction is meaningful.
VWAP resets each session, making it purely an intraday indicator. Moving averages are continuous and can be applied to any timeframe. For multi-day analysis, moving averages are the appropriate choice.
VWAP becomes flatter and more stable as the day progresses, while a moving average maintains consistent sensitivity to price changes. This makes VWAP most useful for identifying the day's equilibrium price and least useful for detecting late-day momentum shifts.
For day traders, VWAP is generally superior to moving averages for identifying institutional support and resistance levels. For swing traders and investors, moving averages remain the better tool.
Anchored VWAP
Anchored VWAP is a variation that allows you to start the VWAP calculation from any specific point on the chart, not just the beginning of the trading day. This powerful tool extends VWAP analysis to swing trading and even longer-term timeframes.
Common anchor points include earnings announcements, significant news events, major swing highs or lows, and gap openings. By anchoring VWAP to these events, you can see the average price that all participants paid since that event occurred.
For example, anchoring VWAP to an earnings gap-up shows the average price of all trades since the announcement. If price returns to this anchored VWAP weeks later, it represents a level where the average post-earnings buyer is at breakeven — a psychologically significant point.
Anchored VWAP from swing lows often provides support during pullbacks, while anchored VWAP from swing highs frequently acts as resistance during rallies. This technique bridges the gap between intraday VWAP analysis and swing trading strategies.
Common VWAP Mistakes
Trading VWAP in the first 15 minutes. Early in the session, VWAP is based on very little data and can swing dramatically. Wait at least 15 to 30 minutes for VWAP to stabilize before using it for trade decisions. The opening volatility distorts the indicator.
Ignoring context. VWAP signals must be interpreted within the broader market context. A VWAP pullback in a stock that gapped up on strong earnings is very different from a VWAP pullback in a stock drifting lower on no news. Always consider the fundamental and technical backdrop.
Using VWAP on daily or weekly charts. Standard VWAP resets each day and is designed for intraday use. Applying it to daily charts produces a single point per day and loses its meaning. Use anchored VWAP or moving averages for higher-timeframe analysis.
Forgetting about the close. Price tends to gravitate toward VWAP into the close, especially during options expiration and index rebalancing days. This end-of-day VWAP magnetism can disrupt trades that were working earlier in the session. Consider tightening stops or taking profits as the close approaches.
Frequently Asked Questions
Is VWAP only for day trading?
Standard VWAP resets at the beginning of each trading session, making it primarily an intraday indicator. However, anchored VWAP allows you to extend VWAP analysis across multiple days, weeks, or even months by choosing a custom starting point. Some platforms also offer multi-day VWAP settings that carry the calculation across sessions. For swing trading and position trading, anchored VWAP from significant events or price levels is more appropriate than session VWAP.
How do you use VWAP for entries?
The most reliable VWAP entry occurs when price pulls back to VWAP in a trending market and shows a reaction. In an uptrend, wait for price to dip to VWAP and form a bullish candlestick pattern or show a volume surge indicating buyers are stepping in. Enter long with a stop just below VWAP. In a downtrend, wait for a rally to VWAP and enter short when you see selling pressure return. The key is patience — let price come to VWAP rather than chasing moves away from it.
What is the difference between VWAP and TWAP?
VWAP weights price by volume, giving more influence to periods with heavy trading activity. TWAP (Time Weighted Average Price) weights each time period equally regardless of volume. VWAP is more commonly used because it reflects actual trading conditions — a price level where millions of shares traded matters more than a level where only a few thousand shares changed hands. Institutions primarily benchmark against VWAP rather than TWAP.
Can VWAP be used for stocks and futures?
Yes, VWAP is effective for any instrument traded with sufficient volume and clear session boundaries. It is most commonly used for equities and equity futures (like ES, NQ, and YM). For forex and crypto markets, which trade nearly 24 hours, VWAP requires a defined session start time, and its effectiveness may differ. For futures, many traders use the regular trading hours session (9:30 AM to 4:00 PM ET) for VWAP calculation, though some include the overnight session.
Why does price always seem to return to VWAP?
Price tends to revert to VWAP because of institutional participation. Large funds and algorithms are programmed to achieve VWAP or better on their executions. This means they systematically buy below VWAP and sell above it, creating a constant gravitational pull toward the VWAP level. Additionally, VWAP represents the true equilibrium price for the day — the level where the average participant is at breakeven — making it a natural attractor for price action.
Disclaimer
This is educational content, not financial advice. Trading involves risk, and you should consult a qualified financial advisor before making any investment decisions. Past performance does not guarantee future results.
Related Articles
12 chapters covering charts, indicators, risk management & more. Plus weekly trading insights.