Aroon Indicator: Measuring Trend Strength & Direction
⚡ Key Takeaways
- The Aroon indicator consists of two lines — Aroon Up and Aroon Down — that measure how many periods have elapsed since the highest high and lowest low within a set lookback window (default 25 periods).
- Aroon values range from 0 to 100: a reading near 100 on Aroon Up means a new high occurred very recently, signaling strong bullish momentum; the same applies to Aroon Down for bearish momentum.
- The crossover of Aroon Up above Aroon Down generates a bullish signal, while the crossover of Aroon Down above Aroon Up generates a bearish signal.
- When both Aroon lines are high (above 70), the market is range-bound and testing both extremes. When both are low (below 30), the market is consolidating with no directional momentum.
- The Aroon Oscillator (Aroon Up minus Aroon Down) simplifies the analysis into a single line that oscillates between -100 and +100.
What Is the Aroon Indicator?
The Aroon indicator is a trend-identification tool developed by Tushar Chande in 1995. The name "Aroon" comes from Sanskrit, meaning "dawn's early light," reflecting the indicator's purpose: to identify the early stages of a new trend.
Unlike momentum oscillators that measure the speed of price changes, the Aroon indicator takes a completely different approach. It measures how much time has passed since the most recent high and low within a lookback period. The logic is intuitive: if a new high was set recently, the market is trending upward; if a new low was set recently, the market is trending downward.
The Aroon indicator consists of two components:
- Aroon Up: Measures the time since the highest high
- Aroon Down: Measures the time since the lowest low
Both lines oscillate between 0 and 100, making them easy to read and interpret.
The Aroon Formula
Aroon Up = ((N - Periods Since Highest High) / N) × 100Understanding the Calculation
The formula calculates what percentage of the lookback period has elapsed since the extreme price. If the highest high occurred just now (0 periods ago), Aroon Up equals 100. If it occurred at the very start of the lookback window (N periods ago), Aroon Up equals 0.
This creates a clear interpretation:
- Aroon Up near 100: The most recent high was very recent — strong uptrend
- Aroon Up near 0: The most recent high was a long time ago — no bullish momentum
- Aroon Down near 100: The most recent low was very recent — strong downtrend
- Aroon Down near 0: The most recent low was a long time ago — no bearish momentum
Pro Tip
Reading Aroon Signals
Strong Uptrend
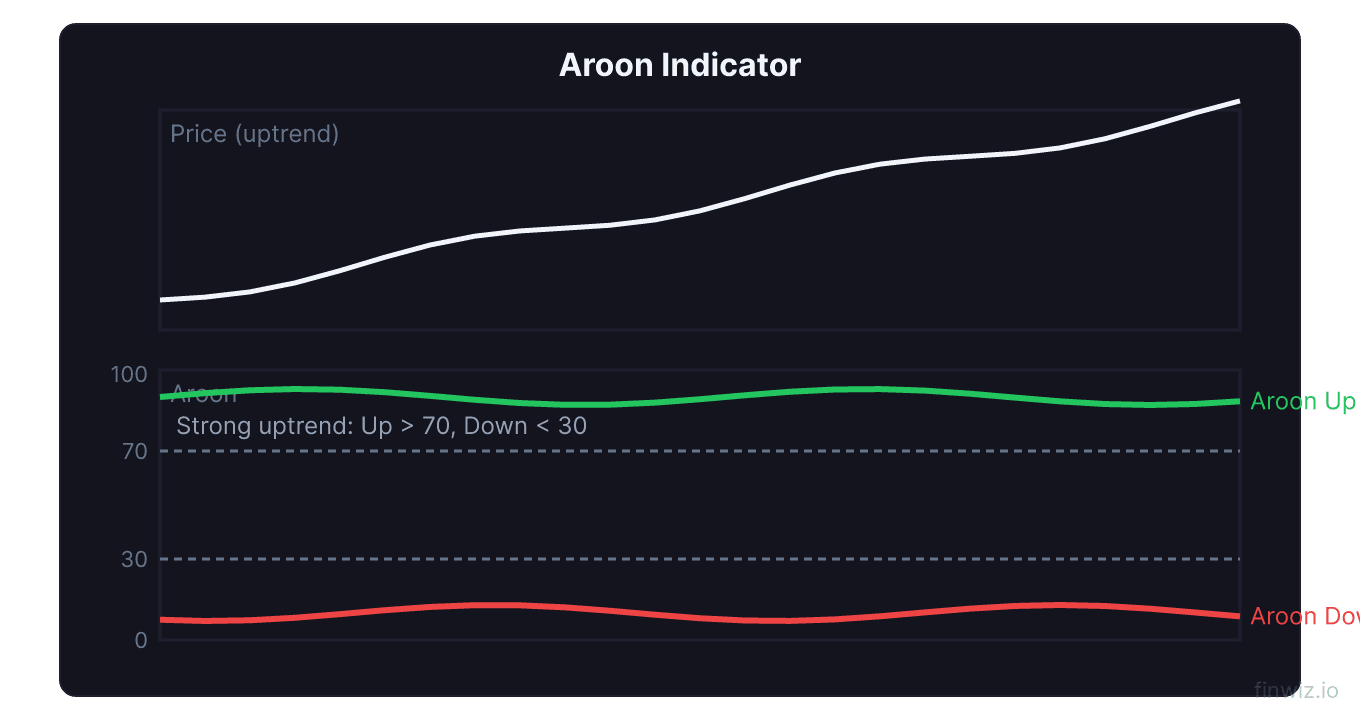
Aroon Up above 70, Aroon Down below 30. This is the classic bullish configuration. The market is consistently setting new highs (Aroon Up stays high) and has not set a new low recently (Aroon Down stays low). The wider the gap between the two lines, the stronger the trend.
Strong Downtrend
Aroon Down above 70, Aroon Up below 30. The bearish mirror image. New lows are being set consistently while no new highs have occurred recently. This confirms a strong downtrend.
Consolidation
Both Aroon Up and Aroon Down below 50. Neither new highs nor new lows are being set, indicating the market is in a consolidation phase with no directional momentum. This is a neutral reading — avoid directional trades during consolidation.
Range-Bound
Both Aroon Up and Aroon Down above 70. The market is swinging between new highs and new lows within the lookback period, indicating a volatile, range-bound market. This occurs when price is oscillating within a trading range, testing both extremes.
| Aroon Up | Aroon Down | Interpretation | Trading Action |
|---|---|---|---|
| Above 70 | Below 30 | Strong uptrend | Look for long entries |
| Below 30 | Above 70 | Strong downtrend | Look for short entries |
| Below 50 | Below 50 | Consolidation | Avoid directional trades |
| Above 70 | Above 70 | Range-bound volatility | Trade the range or wait |
| Crossing above Down | Crossing below Up | Bullish crossover | Potential buy signal |
| Crossing below Down | Crossing above Up | Bearish crossover | Potential sell signal |
Aroon Crossovers
The crossover of Aroon Up and Aroon Down is the indicator's primary directional signal.
Bullish Crossover
When Aroon Up crosses above Aroon Down, it signals that new highs are becoming more recent than new lows — bullish momentum is dominating. This crossover serves as a buy signal, especially when it occurs after a period of Aroon Down dominance (downtrend transitioning to uptrend).
Bearish Crossover
When Aroon Down crosses above Aroon Up, new lows are becoming more recent than new highs — bearish momentum is taking over. This crossover serves as a sell or short signal.
Crossover Reliability
Aroon crossovers work best when:
- The prior trend was established (not a choppy, frequent-crossing environment)
- The crossover occurs near key price levels (support/resistance, moving averages)
- Volume confirms the directional change
- The crossing line reaches above 70 after the crossover, confirming strong momentum
Crossovers in choppy markets produce frequent whipsaws. Use a filter such as requiring the dominant Aroon line to reach at least 70 after crossing to confirm the signal's validity.
The Aroon Oscillator
The Aroon Oscillator simplifies the two-line Aroon indicator into a single line by calculating the difference between Aroon Up and Aroon Down.
Aroon Oscillator = Aroon Up - Aroon DownThe Aroon Oscillator makes trend identification even simpler:
- Above +50: Strong bullish trend
- +50 to 0: Moderate bullish bias
- 0 to -50: Moderate bearish bias
- Below -50: Strong bearish trend
- Zero-line crossover: Trend change signal
Trading Strategies with Aroon
Trend Following Strategy
- Enter long when Aroon Up crosses above 70 and Aroon Down is below 30
- Stay long as long as Aroon Up remains above 50
- Exit when Aroon Up drops below 50 or a bearish crossover occurs
- Enter short when Aroon Down crosses above 70 and Aroon Up is below 30
Breakout Confirmation Strategy
Use Aroon as a confirmation tool for breakouts from chart patterns:
- A breakout from an ascending triangle or cup and handle is more reliable when Aroon Up is above 70 at the breakout
- A breakdown from a descending triangle or head and shoulders is confirmed by Aroon Down above 70
Consolidation Breakout Strategy
- Identify periods where both Aroon lines are below 50 (consolidation)
- Wait for one line to break above 70 (directional resolution)
- Enter in the direction of the breaking line
- Place stop based on recent support/resistance
This strategy capitalizes on the fact that consolidation phases (low Aroon readings) often precede significant directional moves.
Aroon Period Settings
| Period | Sensitivity | Best Use |
|---|---|---|
| 10 | High (very responsive) | Short-term trading, day trading |
| 14 | High | Active swing trading |
| 25 | Standard (default) | Swing and position trading |
| 50 | Low | Position trading, longer trends |
| 75-100 | Very low | Investing, major trend identification |
The 25-period default captures approximately one trading month and provides a balanced view of trend freshness. Shorter periods make the indicator more responsive but generate more crossovers and noise. Longer periods smooth out signals but introduce lag.
Combining Aroon with Other Indicators
Moving averages. Combine Aroon crossovers with moving average alignment. An Aroon bullish crossover occurring while the 20-day MA is above the 50-day MA provides stronger confirmation than the crossover alone.
RSI. Use RSI to filter Aroon signals. Avoid Aroon buy signals when RSI is overbought (above 70) and Aroon sell signals when RSI is oversold (below 30). This prevents entering trends that are already extended.
ADX. The ADX and Aroon are complementary trend tools. ADX measures trend strength while Aroon measures trend freshness. A rising ADX combined with a high Aroon Up reading confirms a strong, fresh uptrend.
Volume indicators. Use OBV or Chaikin Money Flow to confirm that Aroon's trend signals are supported by genuine volume flow.
Donchian Channels. Since Aroon and Donchian Channels are conceptually related, combining them creates a comprehensive breakout-trend system: Donchian defines breakout levels, Aroon confirms trend freshness.
Pro Tip
Limitations
Whipsaws in choppy markets. Like most trend indicators, Aroon produces frequent crossovers and false signals in range-bound, choppy markets. When price oscillates without establishing a trend, the Aroon lines cross repeatedly, generating losing trades.
Lagging nature. Aroon does not predict trend changes — it confirms them after they begin. The new high or low must already have occurred for the indicator to register the signal.
Sensitivity to the lookback period. The indicator's behavior changes significantly with different period settings. A period that is too short creates noise; too long creates excessive lag. There is no universally optimal period.
Does not measure trend magnitude. Aroon tells you how recently a new high or low occurred, but not how large the move was. A small new high one period ago produces the same Aroon Up = 100 as a large new high. Combine with price-based analysis for magnitude assessment.
Frequently Asked Questions
What is the difference between Aroon and ADX?
Both measure trend characteristics but in different ways. Aroon measures how recently new highs and lows were made (time-based). ADX measures the strength of the current trend (magnitude-based). Aroon tells you if a trend is fresh; ADX tells you if a trend is strong. Using both together provides a more complete trend assessment.
Can Aroon be used for day trading?
Yes. On intraday charts, use a 14 or 25-period Aroon. The indicator identifies intraday trends effectively, but expect more whipsaws on lower timeframes. Combine with VWAP and intraday support/resistance levels for better intraday results.
What does it mean when Aroon Up and Down are both near 50?
Both lines near 50 indicate that the most recent high and low occurred approximately halfway through the lookback period. This is a neutral, transitional state — the market has no strong directional bias and may be preparing to choose a direction. Watch for one line to break away from this level.
How do I interpret the Aroon Oscillator at +100 or -100?
An Aroon Oscillator at +100 means Aroon Up is at 100 and Aroon Down is at 0 — the most extreme bullish reading possible. The most recent high was just set, and the most recent low was at the very beginning of the lookback period. This indicates maximum bullish momentum.
Is Aroon better than MACD for trend identification?
They measure different things. MACD measures the relationship between two moving averages (momentum). Aroon measures the recency of price extremes (trend freshness). MACD is better for momentum-based signals and divergence. Aroon is better for identifying new trend initiations. Many traders use both.
What markets work best with the Aroon indicator?
Aroon works best in markets that exhibit clear trending behavior, including trending stocks, ETFs, commodities, and currencies. It is less effective in markets that frequently trade in narrow ranges without establishing clear directional trends.
Disclaimer
This is educational content, not financial advice. Trading involves risk, and you should consult a qualified financial advisor before making any investment decisions. Past performance does not guarantee future results.
Related Articles
12 chapters covering charts, indicators, risk management & more. Plus weekly trading insights.