Trend Lines: How to Draw & Trade Them Correctly
⚡ Key Takeaways
- Trend lines connect swing lows in an uptrend or swing highs in a downtrend to visualize the direction of price movement
- A valid trend line requires at least two touches, but three or more touches significantly increase its reliability
- Channels form when two parallel trend lines contain price action, offering clear buy and sell zones
- Trend line breaks on high volume signal potential trend reversals or accelerations
- Drawing trend lines correctly requires using significant swing points, not minor fluctuations
What Are Trend Lines?
Trend lines are one of the most basic yet powerful tools in technical analysis. They are straight lines drawn on a chart that connect two or more price points, visually representing the direction and speed of a trend.
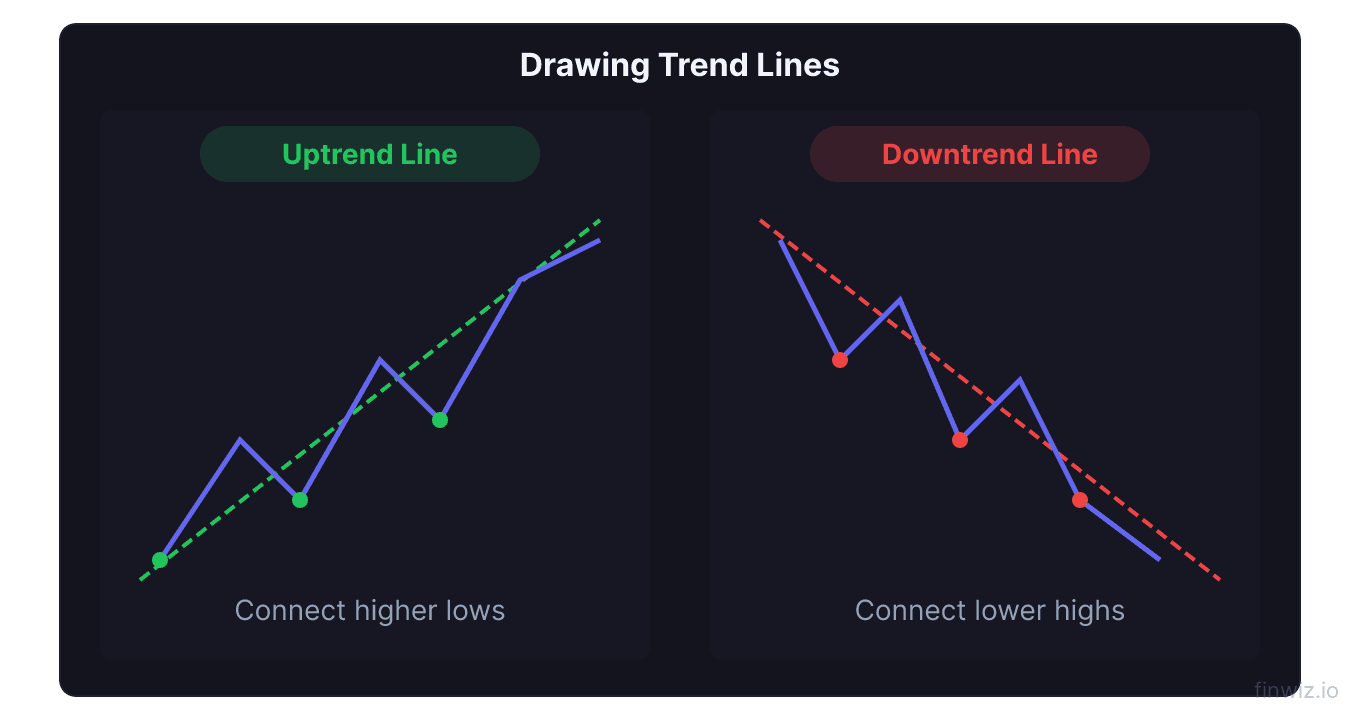
An uptrend line is drawn by connecting two or more ascending swing lows. It acts as dynamic support, showing that buyers are willing to step in at progressively higher prices.
A downtrend line is drawn by connecting two or more descending swing highs. It acts as dynamic resistance, showing that sellers are applying pressure at progressively lower prices.
Trend lines help traders stay on the right side of the market, identify potential reversal points, and set logical entries and exits.
How to Draw Trend Lines Correctly
Drawing trend lines seems simple, but many traders do it incorrectly. The quality of your trend line depends on the points you choose and how strictly you apply the rules.
Step-by-Step Process
- Identify the trend direction: Before drawing a line, determine whether the stock is in an uptrend, downtrend, or range.
- Find significant swing points: For an uptrend, locate clear swing lows where the price reversed upward. For a downtrend, locate clear swing highs where the price reversed downward.
- Connect at least two points: Draw a straight line through two significant swing lows (uptrend) or swing highs (downtrend).
- Extend the line forward: Project the line into the future to see where the next potential support or resistance will occur.
- Validate with a third touch: The trend line becomes highly significant when the price touches it a third time and reacts.
Wicks vs. Bodies
A common debate is whether to draw trend lines through the candle wicks or the candle bodies. There is no universally correct answer.
Some traders prefer wicks because they capture the full range of price action. Others prefer bodies because closing prices reflect more committed trading decisions. A practical approach is to draw the line that connects the most points, whether those are wicks or bodies. If the line needs to be adjusted slightly to accommodate both wicks and bodies, treat the trend line as a zone rather than a precise line.
Pro Tip
The Three-Touch Validation Rule
A trend line with only two touches is a tentative trend line. It gives you a hypothesis about where the trend might continue, but it is not confirmed.
When the price touches the trend line a third time and bounces, the line is considered validated. This third touch proves that multiple sets of buyers (or sellers) are active along that line, making future touches more likely to produce a reaction.
The significance of a trend line increases with:
- Number of touches: More touches mean more validation.
- Duration: A trend line spanning months is more important than one spanning days.
- Timeframe: A trend line on the weekly chart carries more weight than one on the 5-minute chart.
- Volume at touches: Strong volume reactions at the trend line confirm its significance.
Types of Trend Lines
Ascending Trend Lines (Uptrend)
An ascending trend line connects higher swing lows and slopes upward from left to right. It represents a series of buyers stepping in at increasingly higher prices. The steepness of the line reflects the strength of the uptrend.
A steep ascending trend line (greater than 45 degrees) suggests aggressive buying but is unsustainable long-term. These steep trends tend to break quickly and often lead to sharp corrections.
A gradual ascending trend line (around 20-45 degrees) suggests a healthy, sustainable uptrend. These trends can last for months or even years.
Descending Trend Lines (Downtrend)
A descending trend line connects lower swing highs and slopes downward from left to right. It shows sellers consistently entering at lower prices. Breaking above a descending trend line on strong volume is a significant bullish signal.
Horizontal Trend Lines
Horizontal lines connecting equal highs or equal lows represent range-bound conditions. These are the support and resistance levels discussed in our companion guide.
Trading Channels
A channel forms when you can draw two parallel trend lines that contain price action. Channels are excellent trading structures because they provide clearly defined boundaries.
Ascending Channel
An ascending channel consists of a rising support trend line and a parallel rising resistance trend line. Prices oscillate between the two lines. Swing traders can buy near the lower trend line and sell near the upper trend line.
Descending Channel
A descending channel is bounded by a falling resistance trend line and a parallel falling support trend line. Prices move between the lines in a controlled manner. Aggressive traders might short near the upper line and cover near the lower line.
Horizontal Channel (Range)
A horizontal channel is simply a trading range with clearly defined support and resistance. This is the most common channel for swing trading range strategies.
Pro Tip
Trend Line Breakouts
All trend lines eventually break. A trend line breakout is one of the most important signals in technical analysis because it suggests a potential shift in the balance between buyers and sellers.
What Constitutes a Valid Breakout
Not every penetration of a trend line is a true breakout. To filter out false breakouts, apply these criteria:
- Close beyond the line: The price should close decisively beyond the trend line, not just wick through it.
- Volume confirmation: A valid breakout should occur on above-average volume. Low-volume breaks are often traps.
- Follow-through: The next candle after the break should continue in the breakout direction.
- Percentage filter: Some traders require a 2-3% move beyond the line before considering it broken.
Trading a Trend Line Break
When an uptrend line breaks, it signals that buyers are no longer supporting the price at progressively higher levels. This does not automatically mean the stock will crash, but it does suggest the current uptrend is over and a correction or range-bound period may follow.
When a downtrend line breaks, it signals that sellers can no longer keep the price below declining resistance. This is often the first sign of a new uptrend forming.
A common approach is to wait for the retest. After a trend line breaks, the price often pulls back to the broken line (role reversal) before continuing in the new direction. This retest provides a lower-risk entry.
Adjusting Trend Lines
Sometimes the angle of a trend changes without the overall direction changing. This requires you to adjust your trend lines rather than abandon them.
For example, a stock in an uptrend might accelerate, breaking above its original trend line and establishing a steeper trajectory. In this case, draw a new, steeper trend line while keeping the original in place. If the steeper line breaks, the price may fall back to the original, less steep support line.
This fan principle allows you to track multiple potential support and resistance levels within the same broader trend.
Common Trend Line Mistakes
- Forcing the line: If you have to bend or stretch the line to fit, the trend line is not valid. Good trend lines are obvious.
- Using minor swings: Connect significant turning points, not every tiny dip or rally. Minor swings create noisy, unreliable lines.
- Ignoring the bigger picture: A trend line on the 15-minute chart matters far less than one on the daily or weekly chart. Always check multiple timeframes.
- Not adjusting: Markets evolve. A trend line drawn three months ago may need to be redrawn. Regularly review and update your lines.
- Trading every touch blindly: A trend line is a tool, not a guarantee. Always look for confirmation candles and volume before taking a trade at a trend line touch.
Frequently Asked Questions
How many touches does a trend line need to be valid?
A trend line requires a minimum of two touches to draw, but it is not considered validated until it has three touches. The more touches, the more significant the line. However, very steep trend lines with many touches in a short period can still break abruptly.
Should I use wicks or candle bodies to draw trend lines?
There is no definitive rule. Use whichever method connects the most points cleanly. Many traders treat the trend line as a zone rather than a precise level, accommodating both wicks and bodies. The goal is to capture the general trajectory of swing highs or lows.
What happens after a trend line breaks?
After a trend line breaks, the price often retests the broken line in a role reversal pattern. A broken uptrend support line may act as resistance on the retest, and a broken downtrend resistance line may act as support. If the retest holds, it confirms the trend change and provides a trading opportunity.
Can trend lines be used on any timeframe?
Yes. Trend lines work on every timeframe from 1-minute to monthly charts. However, higher timeframe trend lines are more significant because they represent longer-term shifts in supply and demand. When a daily trend line aligns with a weekly trend line, the level carries substantial weight.
What angle should a good trend line have?
The ideal trend line slopes at approximately 30 to 45 degrees. Lines that are too steep (above 60 degrees) represent unsustainable momentum and tend to break quickly. Lines that are too flat suggest weak momentum. The 45-degree angle represents a healthy balance between price advancement and time.
Disclaimer
This is educational content, not financial advice. Trading involves risk, and you should consult a qualified financial advisor before making any investment decisions. Past performance does not guarantee future results.
Related Articles
12 chapters covering charts, indicators, risk management & more. Plus weekly trading insights.