Chart Timeframes Explained: Which One Should You Use?
⚡ Key Takeaways
- Chart timeframes range from 1-minute to monthly, each suited to different trading styles and objectives
- Shorter timeframes (1-min to 15-min) provide granular detail but more noise, suited for scalping and day trading
- Medium timeframes (hourly to daily) balance detail and trend clarity, ideal for swing trading
- Longer timeframes (weekly to monthly) filter out noise and reveal dominant trends for position trading and investing
- Using the wrong timeframe for your trading style leads to poor decisions, premature exits, and unnecessary stress
Why Your Chart Timeframe Matters
The timeframe you choose for your chart determines how much data each candle or bar represents. A 5-minute candle compresses five minutes of trading into one bar. A daily candle compresses an entire session. A monthly candle captures an entire month.
This choice is not trivial. The same stock can look bullish on the 5-minute chart and bearish on the daily chart. Your timeframe shapes your perception of the trend, the significance of support and resistance levels, and the speed at which you need to make decisions.
Selecting the right timeframe depends on your trading style, your time availability, your personality, and your capital. This guide breaks down each timeframe so you can match the right chart to your approach.
The 1-Minute Chart
The 1-minute chart is the fastest commonly used timeframe. Each candle represents just 60 seconds of price action, providing an extremely granular view of trading activity.
Best for: Scalping, very short-term day trading
Pros:
- Maximum detail on price movement
- Allows for precise entry and exit timing
- Captures micro-level price action patterns
Cons:
- Extremely noisy with many false signals
- Requires constant screen attention
- Rapid decision-making can lead to emotional trading
- Commission and slippage costs compound quickly
The 1-minute chart is the domain of scalpers who aim to capture small price moves (a few cents to a quarter) and exit within minutes. It demands intense focus and fast execution. Most traders find this timeframe too stressful for sustained use.
The 5-Minute Chart
The 5-minute chart is the most popular timeframe among active day traders. It smooths out some of the noise from the 1-minute chart while still providing enough detail for intraday trading.
Best for: Day trading
Pros:
- Good balance of detail and clarity for intraday moves
- Patterns and trends are more visible than on 1-minute
- Wide availability of educational content and strategies
- Suitable for both quick trades and multi-hour holds
Cons:
- Still requires active monitoring during market hours
- Can produce false breakout signals
- Not suitable for swing or position trading
Day traders typically use the 5-minute chart as their primary execution timeframe while referencing 15-minute or daily charts for the bigger picture.
The 15-Minute Chart
The 15-minute chart provides a broader intraday perspective. Each candle captures 15 minutes of trading, enough to filter out much of the noise while still allowing for multiple trades per day.
Best for: Day trading, short-term swing trading
Pros:
- Cleaner signals than shorter timeframes
- Patterns are more reliable and significant
- Fewer decisions per day, reducing emotional strain
- Works well as a setup timeframe alongside a 5-minute entry chart
Cons:
- Slower response to rapid price changes
- Fewer trade opportunities per day
- Entry timing may be less precise than shorter timeframes
Many day traders use the 15-minute chart to identify setups and levels, then drop to the 5-minute chart for entry timing. This is a classic multiple time frame approach.
Pro Tip
The 1-Hour Chart
The hourly chart bridges the gap between intraday and multi-day trading. Each candle represents one hour of market activity, smoothing out most intraday noise while capturing meaningful swings.
Best for: Swing trading entries, day trading the macro view
Pros:
- Clear view of intraday trends and levels
- Effective for timing entries on daily chart setups
- Patterns are significant and relatively reliable
- Does not require constant monitoring
Cons:
- Too slow for pure scalping or rapid day trading
- May miss short-lived intraday opportunities
- Fewer candles per day means slower feedback
Swing traders often use the hourly chart as their entry timeframe when the daily chart has identified a setup. The hourly chart provides a more precise entry than the daily while maintaining a manageable pace.
The 4-Hour Chart
The 4-hour chart is widely used in forex trading and is gaining popularity in stock trading. Each candle covers four hours, providing a clean view of multi-day price action.
Best for: Swing trading
Pros:
- Excellent noise filtering while retaining meaningful detail
- Works well as an intermediate between daily and hourly
- Produces reliable patterns and signals
- Requires checking only a few times per day
Cons:
- Limited number of candles per week in stock markets (only about 6-7 per day)
- Less useful for markets with short trading hours
- Fewer trade setups compared to lower timeframes
The Daily Chart
The daily chart is the most widely referenced timeframe in the market and is the standard for swing trading. Each candle represents one full trading session.
Best for: Swing trading, position trading
Pros:
- Clean, noise-free view of the trend
- Support and resistance levels are well-defined and significant
- Widely watched by institutional traders, adding significance to levels and patterns
- Only requires review once per day, ideal for part-time traders
- Excellent historical data for backtesting
Cons:
- Entries and exits are less precise (wide candles mean larger stops)
- Trades develop over days to weeks, requiring patience
- Miss intraday opportunities and volatility
The daily chart is often called the default timeframe because most trading education and research references it. Indicators like the 50-day and 200-day moving averages are based on daily data.
The Weekly Chart
The weekly chart compresses an entire week of trading into a single candle. It provides a high-level view of trends that may not be visible on shorter timeframes.
Best for: Position trading, long-term investing, trend identification
Pros:
- Eliminates virtually all short-term noise
- Trends are clear and well-defined
- Key levels are extremely significant
- Requires minimal time commitment (check once per week)
- Excellent for identifying the dominant trend for multiple time frame analysis
Cons:
- Very few trade signals per year
- Wide candles mean very wide stop losses
- Opportunities develop slowly
- Not suitable for active traders who need regular engagement
Swing traders and position traders use the weekly chart as their higher timeframe to establish directional bias. If the weekly trend is up, they look for buying opportunities on the daily chart.
The Monthly Chart
The monthly chart is the longest commonly used timeframe, with each candle representing an entire calendar month. It is the domain of long-term investors and trend analysts.
Best for: Long-term investing, macro trend analysis
Pros:
- Shows multi-year trends with perfect clarity
- Support and resistance levels are extremely powerful
- Ideal for identifying secular bull and bear markets
- Virtually no noise
Cons:
- Extremely few signals (one candle per month)
- Not practical for active trading
- Stop losses based on monthly levels can be very wide
- Requires a long-term mindset and patience
The monthly chart is valuable for context even if you trade shorter timeframes. Understanding where price is relative to monthly support and resistance helps you avoid fighting the long-term trend.
Choosing the Right Timeframe for Your Style
| Trading Style | Primary Timeframe | Higher TF for Context | Time Commitment |
|---|---|---|---|
| Scalping | 1-minute | 5-minute or 15-minute | Full-time during market hours |
| Day Trading | 5-minute | 15-minute and daily | Full-time during market hours |
| Swing Trading | Daily | Weekly | 30-60 minutes per day |
| Position Trading | Weekly | Monthly | 1-2 hours per week |
| Investing | Monthly | Quarterly earnings | A few hours per quarter |
Your personality matters as much as your strategy. If you are impatient, you may gravitate toward shorter timeframes, but be aware that they demand more discipline. If you prefer a relaxed approach, longer timeframes suit you better but require patience.
Pro Tip
The Cost of Using the Wrong Timeframe
Using a timeframe that does not match your style creates several problems:
- Premature exits: A swing trader watching 5-minute charts may sell during a normal intraday pullback that has no bearing on the daily trend.
- Late entries: A day trader watching daily charts may enter after the bulk of the move has already occurred on the intraday chart.
- Excessive trading: Watching shorter timeframes than necessary leads to overtrading, more commissions, and more emotional decisions.
- Missed context: Watching longer timeframes than necessary may cause you to miss important short-term dynamics.
Frequently Asked Questions
Can I use multiple timeframes at once?
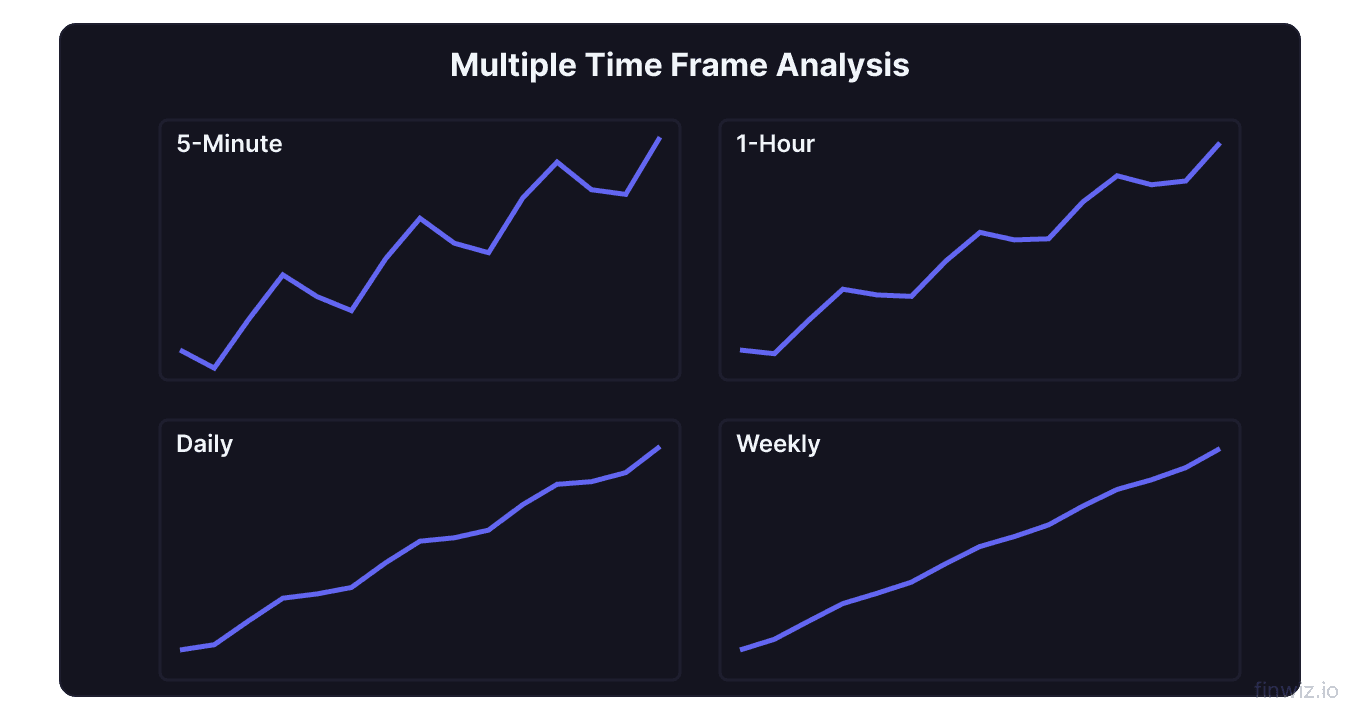
Yes, and it is recommended. Multiple time frame analysis uses two to three timeframes together. The higher timeframe sets the trend direction, the middle timeframe identifies setups, and the lower timeframe times entries. This approach significantly improves trade quality.
Why do the same indicators give different signals on different timeframes?
Indicators are calculated from the data on each timeframe. A 14-period RSI on a 5-minute chart measures momentum over the last 70 minutes, while a 14-period RSI on a daily chart measures momentum over the last 14 trading days. The higher timeframe indicator reflects a longer-term reality.
Should I change timeframes based on market conditions?
Generally, no. Your timeframe should match your trading style, which should remain consistent. However, if the market becomes unusually volatile, some traders may temporarily move to a higher timeframe to avoid being whipsawed on shorter charts.
How do I know if I am on the wrong timeframe?
Signs you are on the wrong timeframe include frequent stops being hit that would not have been triggered on a higher timeframe, constant switching between charts, taking too many trades, or missing moves because your chart is too slow. If your results are inconsistent and your stress is high, experiment with a different timeframe.
Is the daily chart really the best starting point?
For most traders, yes. The daily chart is the most widely analyzed, meaning support and resistance levels and patterns are respected by the largest number of participants. It also allows you to trade with a part-time schedule, which is important while you are still learning.
Disclaimer
This is educational content, not financial advice. Trading involves risk, and you should consult a qualified financial advisor before making any investment decisions. Past performance does not guarantee future results.
Related Articles
12 chapters covering charts, indicators, risk management & more. Plus weekly trading insights.