Backtesting: How to Test a Trading Strategy Before Risking Money
⚡ Key Takeaways
- Backtesting is the process of applying a trading strategy to historical market data to evaluate how it would have performed in the past, before risking real capital.
- The backtesting process follows four steps: define rules (entry, exit, position sizing), obtain historical data, run the simulation, and analyze the results (win rate, risk/reward, maximum drawdown, Sharpe ratio).
- The three most dangerous pitfalls in backtesting are overfitting (optimizing a strategy to fit past data so perfectly it fails on new data), survivorship bias (using only stocks that still exist today), and look-ahead bias (accidentally using information that was not available at the time of the trade).
- Popular backtesting tools range from code-based platforms like Python (with pandas and backtrader) to visual platforms like TradingView (Pine Script) and dedicated applications like Amibroker and QuantConnect.
- A backtested strategy that looks profitable is only the starting point — paper trading and gradual capital deployment are essential steps between backtesting and live trading.
What Is Backtesting?
Backtesting is the practice of testing a trading strategy on historical data to determine whether it would have been profitable. You take a clearly defined set of rules — when to buy, when to sell, how much to risk — apply those rules to past price data, and measure the results.
Think of backtesting as a simulator for trading strategies. Just as a pilot trains in a flight simulator before flying a real aircraft, a trader tests their strategy on historical data before deploying real capital. The simulator cannot perfectly replicate live conditions, but it reveals fatal flaws, validates core logic, and builds confidence before the real test begins.
Backtesting matters because most trading ideas sound reasonable in theory but fail in practice. A strategy that "buys when RSI drops below 30 and sells when it rises above 70" seems logical, but does it actually make money? Over what time period? With what drawdowns? At what win rate? Backtesting answers these questions with data instead of guesses.
Every professional trading firm — from quantitative hedge funds to proprietary trading desks — rigorously backtests strategies before allocating capital. Individual traders who skip this step are essentially deploying unproven theories with real money.
The Four-Step Backtesting Process
Step 1: Define Your Rules
A backtestable strategy must have completely objective, unambiguous rules. If any part of the strategy requires subjective judgment ("the trend looks strong" or "volume seems high"), it cannot be reliably backtested.
Your rules must specify:
Entry conditions:
- What triggers a buy? (e.g., RSI below 30 AND price above 200-day moving average)
- What triggers a sell/short? (e.g., RSI above 70 AND price below 200-day MA)
Exit conditions:
- Profit target (e.g., sell when 10% profit is reached)
- Stop-loss (e.g., sell when 5% loss is reached)
- Time-based exit (e.g., close after 10 trading days regardless of P/L)
- Indicator-based exit (e.g., exit when RSI crosses back above 50)
- How much capital per trade? (e.g., 5% of portfolio)
- Maximum number of simultaneous positions? (e.g., 5 positions max)
- How to handle partial fills or slippage?
Universe:
- Which stocks/ETFs does the strategy trade? (e.g., S&P 500 components, all NASDAQ stocks above $10)
Pro Tip
Step 2: Obtain Historical Data
Your backtest is only as good as your data. You need clean, accurate historical price data that includes:
- Open, High, Low, Close (OHLC) prices
- Volume
- Adjusted prices (accounting for stock splits, dividends, and corporate actions)
- Sufficient history (minimum 5-10 years for most strategies)
Data sources for retail traders:
| Source | Cost | Quality | History |
|---|---|---|---|
| Yahoo Finance | Free | Good for daily data | 20+ years |
| Alpha Vantage | Free/Low cost | Good for daily/intraday | 20+ years daily |
| Polygon.io | Moderate | Excellent, tick-level | 10+ years |
| Quandl (Nasdaq Data) | Moderate | Institutional grade | 30+ years |
| Interactive Brokers | Included with account | Excellent | Varies |
| TradingView | Subscription | Good, built-in | Varies by symbol |
Step 3: Run the Simulation
With rules defined and data loaded, the simulation engine walks through the historical data day by day (or bar by bar), applying your rules at each step:
- Check if entry conditions are met
- If yes, simulate the trade entry at the appropriate price
- Track the position day by day
- Check exit conditions at each step
- When exit conditions are met, close the trade and record the P/L
- Move to the next opportunity
- Repeat for the entire historical period
The simulation must account for realistic constraints:
- Commission costs: Include brokerage fees per trade
- Slippage: Assume your fill price is slightly worse than the signal price (typically 0.05-0.10% for liquid stocks)
- Capital constraints: You cannot take every signal if you do not have unlimited capital
- Position limits: Only enter trades that your capital allows
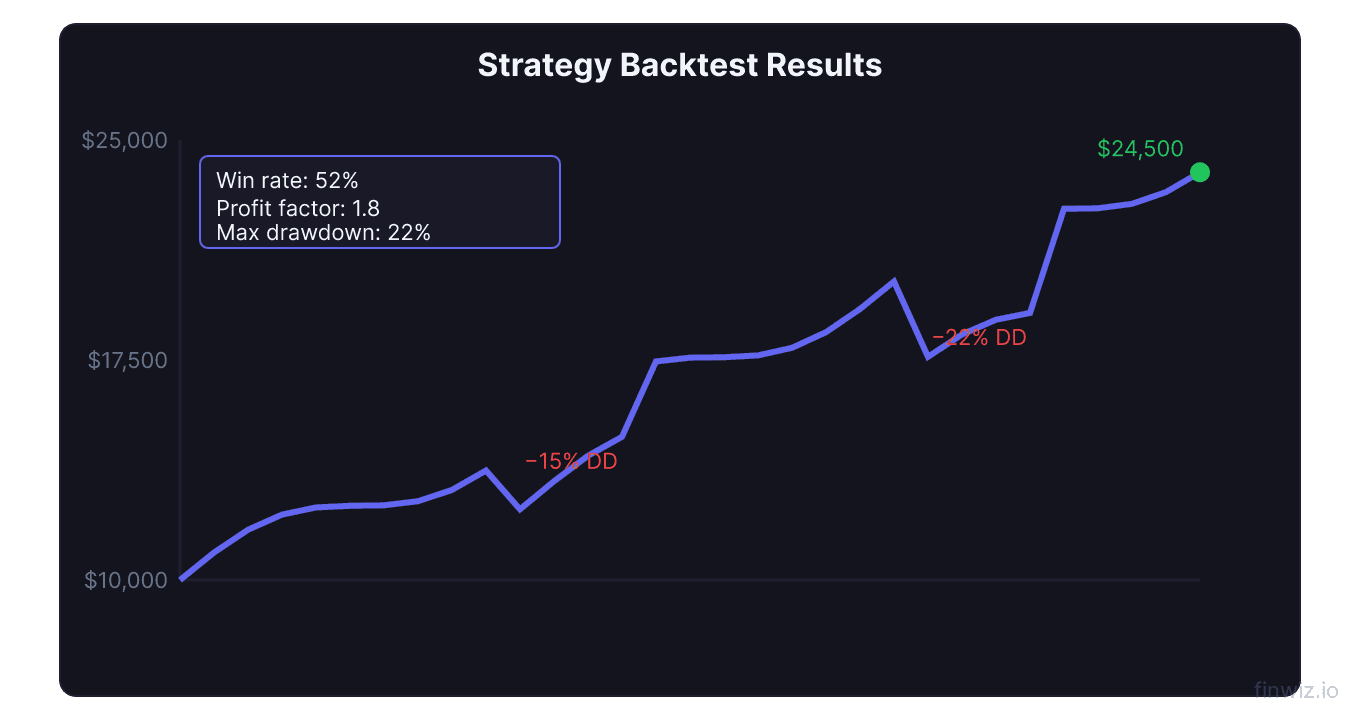
Step 4: Analyze the Results
The backtest output should include these key metrics:
Essential Backtest Metrics:The Three Deadly Backtesting Pitfalls
Pitfall 1: Overfitting
Overfitting (also called curve-fitting or data mining) is the most common and most dangerous backtesting trap. It occurs when you optimize a strategy's parameters so precisely to historical data that it performs brilliantly in the backtest but fails completely on new, unseen data.
How overfitting happens:
You start with a simple RSI strategy: buy when RSI(14) drops below 30. It shows promise but is not perfect. So you adjust:
- Change RSI period from 14 to 11 (slightly better results)
- Add a condition: only buy on Tuesdays and Wednesdays (backtested slightly better)
- Add a filter: only buy if volume is between 1.2x and 1.8x average (fits past data well)
- Add a seasonal filter: avoid August and September (worked historically)
Each optimization looks reasonable in isolation, but collectively they have molded the strategy to fit the specific noise patterns of the historical data rather than capturing a genuine market edge. The strategy has memorized the test instead of learning the lesson.
How to avoid overfitting:
- Keep rules simple: Fewer parameters = less risk of overfitting
- Out-of-sample testing: Divide your data into two portions. Develop the strategy on the first portion (in-sample) and validate it on the second (out-of-sample). If performance collapses out of sample, the strategy is overfit.
- Walk-forward analysis: Repeatedly optimize on a rolling in-sample window and test on the subsequent out-of-sample window. This mimics real-world deployment.
- Robustness checks: Vary parameters slightly. If the strategy works with RSI(14) but breaks with RSI(12) or RSI(16), the edge is fragile and likely overfit.
Pitfall 2: Survivorship Bias
Survivorship bias occurs when your backtest universe includes only stocks that exist today, excluding companies that went bankrupt, were delisted, or were acquired during the test period.
Why it matters:
If you backtest a mean reversion strategy ("buy stocks that drop 50%"), a dataset that only includes surviving companies will show excellent results — because every stock that dropped 50% and survived eventually recovered (that is why it survived). But many stocks that dropped 50% went to zero. Those failures are missing from your survivorship-biased dataset, inflating your backtested returns.
How to avoid it:
- Use point-in-time databases that include delisted stocks (Compustat, CRSP)
- If using free data sources, manually add stocks that were removed from indices during your test period
- Be especially cautious with strategies that buy distressed or low-priced stocks — these are most affected by survivorship bias
Pitfall 3: Look-Ahead Bias
Look-ahead bias occurs when your backtest uses information that was not actually available at the time the trade would have been executed.
Common examples:
- Using today's adjusted stock prices to make trading decisions in the past (dividend adjustments change historical close prices)
- Trading on earnings results before the earnings were actually released
- Using an indicator that requires future data points in its calculation
- Entering at the day's closing price when the signal was generated based on that same closing price (you cannot know the close before it happens)
How to avoid it:
- Always use point-in-time data where possible
- Lag your signals by one bar (if the signal appears at today's close, enter at tomorrow's open)
- Verify that no indicator in your strategy uses forward-looking calculations
- Be skeptical of strategies that enter at the exact best price of the day
Pro Tip
Backtesting Tools and Platforms
Python (Most Flexible)
Python is the most popular language for backtesting due to its extensive libraries and flexibility.
Key libraries:
- pandas: Data manipulation and analysis
- backtrader: Full-featured backtesting framework
- zipline: Originally developed by Quantopian, open-source backtesting engine
- vectorbt: High-performance vectorized backtesting
- yfinance: Free historical data from Yahoo Finance
Python is ideal for traders who want complete control over their backtesting logic and are comfortable with coding.
TradingView (Pine Script)
TradingView's Pine Script language allows visual backtesting directly on charts. It is the most accessible option for non-programmers.
Advantages:
- Built-in strategy tester with performance summary
- Visual representation of trades on the chart
- Large community library of shared strategies
- No data management required
Limitations:
- Limited to TradingView's data history
- Cannot easily test portfolio-level strategies
- Processing speed limitations for complex strategies
Dedicated Platforms
| Platform | Best For | Programming Required |
|---|---|---|
| Amibroker | Fast formula-based backtesting | AFL (Amibroker Formula Language) |
| QuantConnect | Cloud-based, institutional grade | Python, C# |
| TradeStation | Broker-integrated backtesting | EasyLanguage |
| NinjaTrader | Futures and options | NinjaScript (C#) |
| MetaTrader | Forex | MQL4/MQL5 |
From Backtest to Live Trading
Step 1: Out-of-Sample Validation
After your backtest shows promising results on the in-sample data, test it on a completely separate data period. If the strategy was developed on 2010-2020 data, test it on 2020-2025 data. Performance degradation is expected (typically 30-50% worse than in-sample), but the strategy should remain profitable.
Step 2: Paper Trading
Transition to paper trading — running the strategy in real time with simulated capital. Paper trading reveals execution issues that backtesting misses:
- Can you actually execute at the prices the backtest assumes?
- Do the signals generate at times when you are available to act?
- Is the strategy emotionally tolerable when watching it in real time?
- Are there liquidity constraints that the backtest ignored?
Paper trade for a minimum of 3-6 months or 50-100 trade signals, whichever comes first.
Step 3: Small Live Capital
Begin live trading with a small fraction (10-25%) of the capital you intend to eventually deploy. This tests the strategy with real execution costs, real slippage, and real emotions. Monitor closely and compare live results to backtested expectations.
Step 4: Full Deployment
Once live results confirm the backtested edge (allowing for reasonable degradation), gradually increase capital to the full intended allocation.
Building a Robust Backtesting Framework
The Checklist
Before trusting any backtest result, verify:
- Rules are completely objective and unambiguous
- Data includes survivorship-free history
- Signals are lagged by at least one bar (no look-ahead bias)
- Commissions and slippage are included
- Out-of-sample testing performed
- Parameter sensitivity tested (does it break with small changes?)
- Maximum drawdown is tolerable
- Number of trades is statistically significant (minimum 30, preferably 100+)
- Strategy works across multiple market environments (bull, bear, sideways)
- Profit is not concentrated in a few outlier trades
FAQ
How much historical data do I need for backtesting?
A minimum of 5-10 years of daily data is recommended for strategies with average holding periods of days to weeks. The data should include at least one bull market, one bear market, and one sideways/range-bound period to ensure the strategy works across different environments. For intraday strategies, 1-3 years of minute-level data is typical.
What is a good Sharpe ratio for a backtested strategy?
A backtested Sharpe ratio above 1.0 is considered acceptable, above 1.5 is good, and above 2.0 is excellent. However, backtested Sharpe ratios are almost always higher than live Sharpe ratios due to the various biases discussed above. Expect live performance to be 30-50% worse than backtested results.
Can I backtest options strategies?
Yes, but it is significantly more complex than backtesting stock strategies. Options backtesting requires historical options pricing data (which is expensive and harder to obtain), modeling of Greeks and implied volatility changes, and handling of exercise/assignment mechanics. Platforms like OptionVue, QuantConnect, and tastytrade offer options backtesting capabilities.
Why does my strategy work in backtesting but fail in live trading?
The most common reasons are: (1) overfitting — the strategy memorized past patterns that did not repeat, (2) execution differences — slippage and fills are worse in real markets than assumed in backtesting, (3) emotional interference — you deviate from the rules under real financial pressure, (4) changing market conditions — the market regime that the strategy was optimized for has shifted, and (5) sample size issues — the backtested period was too short or unrepresentative.
Is backtesting necessary for discretionary traders?
Even discretionary traders benefit from backtesting their core ideas. While you cannot perfectly backtest subjective judgment, you can test the objective components (e.g., "does buying RSI oversold conditions in stocks above the 200-day MA tend to work?"). This gives you a statistical foundation for your discretionary decisions.
Disclaimer
This is educational content, not financial advice. Trading involves risk, and you should consult a qualified financial advisor before making any investment decisions. Past performance does not guarantee future results.
Related Articles
12 chapters covering charts, indicators, risk management & more. Plus weekly trading insights.