Trading Zones: Why Support & Resistance Are Ranges, Not Lines
⚡ Key Takeaways
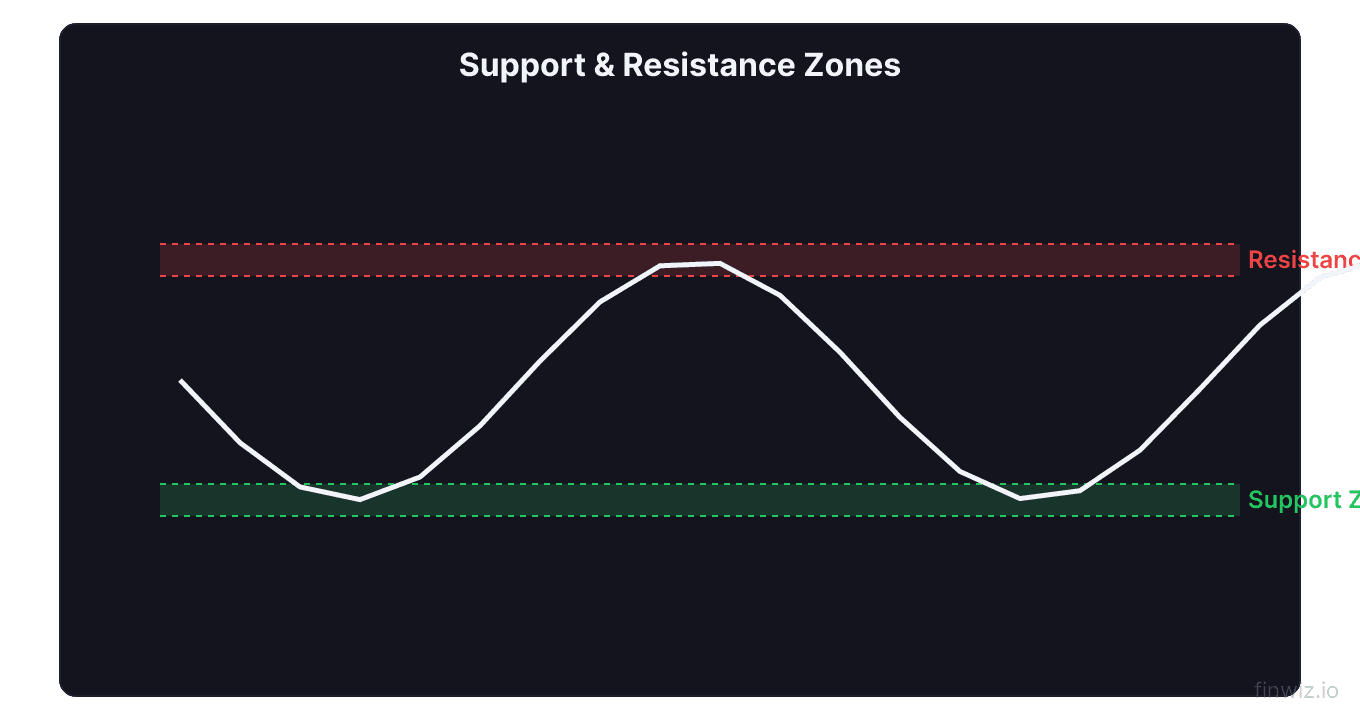
- Support and resistance zones are price ranges where buying or selling pressure concentrates, not single exact price lines.
- Zones are more reliable than lines because price rarely reverses at one precise tick — it reacts across a range defined by wicks, volume clusters, and multiple touches.
- The thickness of a zone reflects the timeframe and volatility of the asset — higher timeframes and more volatile stocks produce wider zones.
- Volume profile analysis helps confirm zones by showing where the most shares actually changed hands, revealing true areas of interest.
- Treating support and resistance as zones rather than lines reduces false breakout signals and improves trade entry timing.
Why Lines Fail and Zones Work
If you have drawn a horizontal line at a support level and watched price slice right through it before reversing two points lower, you already understand the problem with treating support and resistance as exact prices.
Support and resistance are ranges, not lines. Markets are not algorithms that reverse at $150.00 precisely. They are collections of thousands of participants with orders scattered across a price area. Some traders set buy orders at $149.50, others at $150, others at $150.25. The cumulative effect is a band of demand, not a single price point.
When you draw a thin line and expect price to respect it to the penny, you set yourself up for frustration. You get stopped out one tick below support, only to watch price reverse. You enter a breakout that immediately fails because price barely pierced your line before snapping back.
Switching from lines to zones solves both problems. A zone gives price room to breathe. It acknowledges that support at $150 really means support between $148.50 and $150.50. This shift in thinking is one of the most practical upgrades a developing trader can make.
How to Identify Support and Resistance Zones
Building accurate zones requires looking at multiple data points rather than drawing a line through a single swing high or low.
Use the Wicks
Candle wicks are the primary building material for zones. When price approaches a level and reverses, the wick marks the furthest point of rejection. But across multiple tests of the same area, those wicks will land at slightly different prices.
Pull up a daily chart of AAPL and find a level where price has bounced multiple times. Note where the lowest wicks landed on each bounce. The range between the highest wick low and the lowest wick low defines your support zone. Do the same with upper wicks at resistance.
This method captures the real behavior of buyers and sellers rather than imposing an artificial exact level. A support zone on SPY might span $2-3, while the same concept on a lower-priced stock might span $0.50.
Count Multiple Touches
A zone gains credibility with each touch. Two touches establish a potential zone. Three or more touches confirm it. Each time price enters the zone and reverses, more traders notice the level, and more orders accumulate there for the next test.
However, zones weaken with repeated testing. Every touch absorbs some of the pending orders in that area. After five or six tests, the pool of buyers (at support) or sellers (at resistance) may be exhausted. This is often how breakouts develop — the zone finally runs out of defenders.
Pro Tip
Use Volume Profile
Volume profile displays the total volume traded at each price level over a specified period, shown as a horizontal histogram on the chart. This tool directly reveals where the most trading activity occurred, which is the definition of a true support or resistance zone.
High-volume nodes on a volume profile represent prices where buyers and sellers reached agreement and large amounts of stock changed hands. These are strong zones because many participants have positions anchored at those prices — they will defend those levels.
Low-volume nodes are prices that the market moved through quickly with little agreement. These are weak zones that are unlikely to provide meaningful support or resistance.
When a high-volume node from the volume profile aligns with a zone identified by wick analysis and multiple touches, you have a high-confidence zone. NVDA, for example, often builds dense volume nodes during consolidation phases that later act as strong support when retested during pullbacks.
Defining Zone Thickness
The width of your zones should reflect the asset and timeframe you trade.
| Factor | Thinner Zones | Wider Zones |
|---|---|---|
| Timeframe | 5-minute, 15-minute charts | Daily, weekly charts |
| Volatility | Low-volatility stocks (KO, PG) | High-volatility stocks (NVDA, TSLA) |
| Price level | Lower-priced stocks | Higher-priced stocks |
| Average True Range | Low ATR | High ATR |
A practical rule: set your zone width to approximately 0.5% to 1.5% of the stock price on daily charts. For SPY trading at $500, that means zones of roughly $2.50 to $7.50 wide. For a $50 stock like KO, zones might be $0.25 to $0.75 wide.
Approximate Zone Width = Stock Price x 0.005 to Stock Price x 0.015Trading with Zones Instead of Lines
Entries
Instead of placing a buy order at a single support price, use the zone to plan entries. Place your order within the zone, or wait for a bullish candlestick reversal pattern to form within the zone before entering. This approach often gets you a better average price than chasing the first touch of a line.
For example, if MSFT has a support zone between $410 and $414, you might scale into a position by buying one-third at $414, one-third at $412, and one-third at $410 — or simply wait for a hammer candle within the zone as your entry signal.
Stop Losses
Place stop losses below the entire support zone, not at the zone boundary. If your support zone is $148-$150, a stop at $149 will get triggered by normal zone interaction. A stop at $147.50 — below the full zone — gives the trade room to work while still protecting against a genuine breakdown.
Breakouts
Zones also improve breakout trading. A genuine breakout does not just poke above a resistance line — it clears the entire resistance zone and closes above it. Requiring a full zone clearance filters out many false breakouts.
When SPY breaks above a resistance zone, wait for a candle close above the top of the zone, ideally with above-average volume. Then the top of the old resistance zone becomes the top of a new support zone. This concept of polarity — resistance becoming support and vice versa — applies to zones just as it does to lines, but with a wider margin that absorbs more noise.
Pro Tip
Common Mistakes with Zones
Making zones too wide. A zone that spans 5% of the stock price is not useful — it is just a large area of uncertainty. Keep zones tight enough to be actionable. If your zone is too wide, zoom into a lower timeframe to refine it.
Ignoring zone depletion. Every test of a zone absorbs some of the orders defending it. Do not treat a zone that has been tested six times the same as one tested twice. Fresh zones with two to three touches are the strongest.
Drawing zones without volume confirmation. A level where price reversed once on light volume is a weak zone. Prioritize zones where reversals occurred on strong volume and where volume profile shows dense trading activity.
Forcing zones where none exist. Not every price swing creates a meaningful zone. Sometimes price moves through an area without creating any notable supply or demand. If you have to stretch to justify a zone, it probably is not one.
Frequently Asked Questions
How do I know if a support zone will hold or break?
Watch the character of each bounce. If price enters the zone and produces a strong reversal candle with volume, the zone is healthy. If price enters the zone and lingers, producing small-bodied indecision candles on declining volume, the zone is weakening. Also check the broader trend — zones aligned with the dominant trend are more likely to hold than zones opposing it.
Should I draw zones based on candle bodies or wicks?
Use both. The wicks define the outer boundaries of the zone (the extremes of rejection), while the cluster of candle bodies defines the core of the zone. The area between the wick extremes and the body cluster is where you have the most flexibility for entries and stop placement.
How many touches does a zone need to be valid?
Two touches create a potential zone. Three or more touches confirm it. However, quality matters more than quantity. Two touches with high volume and strong reversal candles create a more reliable zone than four touches on thin volume with weak reactions.
12 chapters covering charts, indicators, risk management & more. Plus weekly trading insights.