Relative Strength: How to Find Stocks Outperforming the Market
⚡ Key Takeaways
- Relative strength compares a stock's price performance against a benchmark like the S&P 500, revealing whether it is outperforming or underperforming the broader market, which is distinct from the RSI momentum oscillator.
- The most powerful buy signal occurs when a stock breaks to a new price high while its RS line simultaneously makes a new high, confirming both absolute and relative strength as a hallmark of market leadership.
- Sector-level RS analysis forms the foundation of sector rotation strategies, helping traders identify which sectors are leading or lagging and whether the market favors risk-on or defensive positioning.
- RS line patterns often lead price action, so a deteriorating RS line during a price rally serves as an early warning that the trend is weakening relative to alternatives even before the absolute price turns down.
- Stocks that maintain flat or rising RS lines during market corrections are often the first to rally in the recovery and tend to outperform over subsequent months, making them strong candidates for early recovery positioning.
What Is Relative Strength?
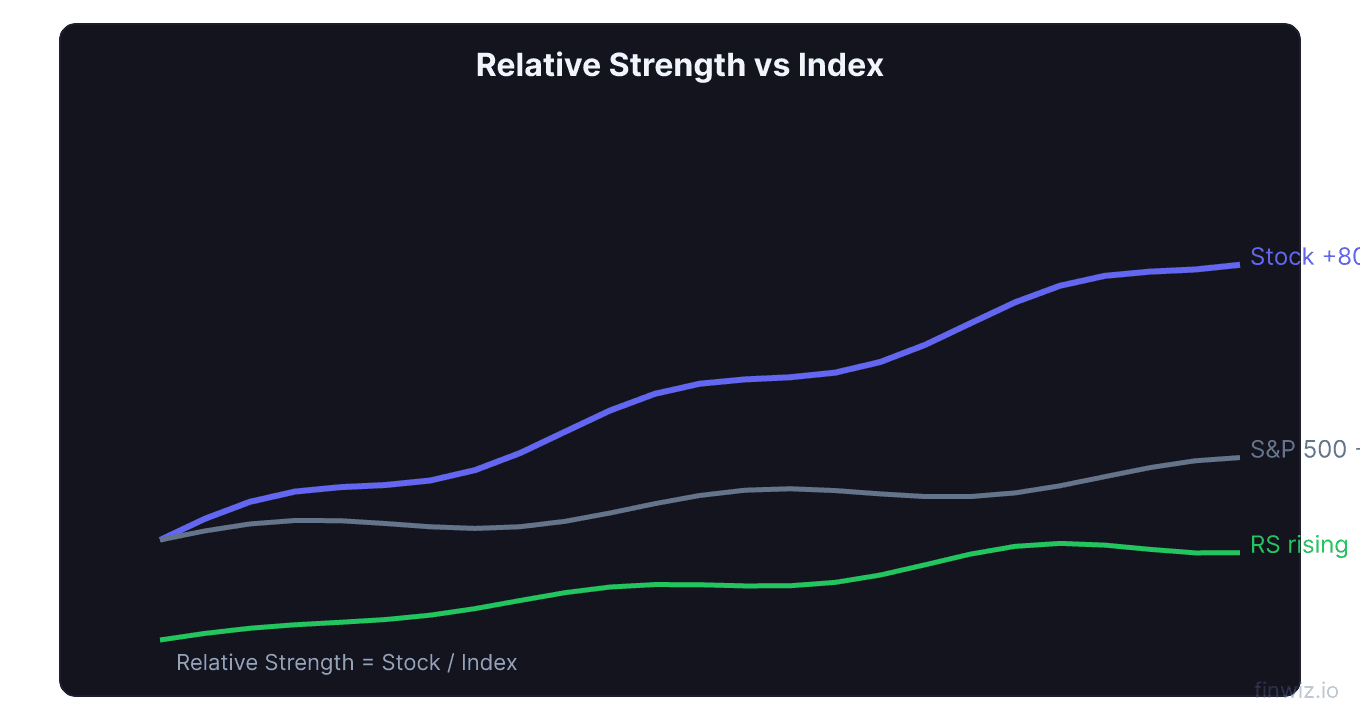
Relative strength (RS) is a technical analysis tool that compares the price performance of one security against another — usually a benchmark index like the S&P 500. It answers a simple but powerful question: is this stock (or sector or market) outperforming or underperforming the broader market?
The concept is distinct from the Relative Strength Index (RSI), which is a momentum oscillator that measures a single security's internal price momentum. Relative strength is a comparative measure between two assets, while RSI is an absolute measure of one asset's overbought/oversold condition.
Relative strength analysis is used by institutional investors, fund managers, and active traders to identify the strongest and weakest stocks and sectors. The core principle is straightforward: buy what is strong, avoid or short what is weak. Stocks showing persistent relative strength tend to continue outperforming.
The Relative Strength Ratio
The RS ratio is calculated by dividing the price of the security by the price of the benchmark:
Relative Strength Ratio = Stock Price ÷ Benchmark PriceThe absolute value of the ratio is less important than its direction. When the RS ratio is rising, the stock is outperforming. When it is falling, the stock is underperforming. When it is flat, the stock is performing in line with the benchmark.
Most charting platforms plot the RS line as a separate indicator below the price chart, making it easy to visualize the relationship over time.
Reading the Relative Strength Line
The RS line provides several actionable signals:
Rising RS line: The stock is gaining ground relative to the benchmark. This is bullish and suggests institutional favor or fundamental strength that is not yet fully reflected in the absolute price.
Falling RS line: The stock is losing ground relative to the benchmark. Even if the stock's absolute price is rising, a falling RS line means it is rising less than the market — you would be better off owning the index.
RS line at new highs: When the RS line reaches a new high, especially before the stock's price reaches a new high, it is a particularly strong bullish signal. It means the stock is leading the market.
RS line divergence: When a stock makes a new price high but the RS line does not, it signals that the stock is losing relative momentum. This bearish divergence often precedes underperformance.
| RS Line Behavior | Signal | Action |
|---|---|---|
| RS making new highs | Strong outperformance | Buy/add to position |
| RS trending higher | Consistent outperformance | Hold/buy dips |
| RS flat | Performing in line with market | Neutral |
| RS trending lower | Consistent underperformance | Avoid/reduce position |
| RS making new lows | Strong underperformance | Sell/short candidate |
Pro Tip
Sector Relative Strength
Applying RS analysis at the sector level is the foundation of sector rotation strategies. By comparing each sector's performance to the S&P 500, you can identify which sectors are leading and lagging.
Sector RS analysis helps answer these questions:
- Which sectors are currently in favor with institutional investors?
- Which sectors are losing momentum?
- Are defensive or offensive sectors leading? (This reveals the market's risk appetite)
- Is the current rotation consistent with the stage of the business cycle?
| Sector | RS Rising = | RS Falling = |
|---|---|---|
| Technology | Growth/risk-on environment | Rotation to value/defense |
| Utilities | Risk-off, defensive positioning | Confidence returning |
| Financials | Economic expansion expectations | Credit concerns |
| Energy | Commodity inflation, late cycle | Deflation, oversupply |
| Healthcare | Defensive rotation | Risk-on rotation |
| Consumer Discretionary | Consumer confidence strong | Economic slowdown fears |
| Consumer Staples | Defensive positioning | Risk appetite returning |
RS Line Breakouts and Breakdowns
Just like price charts, the RS line forms patterns and generates breakout/breakdown signals:
RS line breakout above a downtrend line. When the RS line has been declining (underperforming) and breaks above its downtrend line, it signals that the stock is beginning to outperform. This often precedes a price breakout.
RS line breaking above a resistance level. When the RS line pushes above a prior high, it confirms a new phase of relative outperformance.
RS line breaking below support. When the RS line drops below a prior low, it confirms accelerating underperformance. This is a warning to exit or avoid the stock.
These RS line patterns are particularly useful because they often lead price action. A stock may continue to rise in absolute terms, but its RS line deteriorating is an early warning that the trend is weakening relative to alternatives.
Relative Strength and Stock Screening
RS analysis is a powerful screening tool for identifying trading candidates. Here is a methodical approach:
Step 1: Screen for sector RS. Identify the 2-3 sectors with the strongest RS lines (rising and at or near new highs). Focus your analysis on stocks within these leading sectors.
Step 2: Screen for stock RS within leading sectors. Within the strongest sectors, identify individual stocks with the highest RS ratios or the most rapidly improving RS lines.
Step 3: Apply technical analysis. On the highest-RS stocks, look for chart patterns, volume confirmation, and candlestick signals to time entries.
Step 4: Monitor RS for exit signals. When the RS line begins deteriorating — especially if it breaks below a rising trendline — consider reducing or exiting the position.
RS Ranking Method:Relative Strength vs. RSI: Understanding the Difference
These two indicators are frequently confused because of their similar names. They measure completely different things:
| Feature | Relative Strength (RS) | Relative Strength Index (RSI) |
|---|---|---|
| What it measures | Performance vs. a benchmark | Internal momentum |
| Calculation | Price ratio (Stock ÷ Benchmark) | Ratio of avg gains to avg losses |
| Range | Unbounded | 0 to 100 |
| Overbought/oversold | Not applicable | RSI > 70 / RSI < 30 |
| Comparison | Two securities | One security |
| Best for | Stock selection, sector analysis | Timing entries and exits |
Both tools are valuable but serve different purposes. RS helps you decide what to trade; RSI helps you decide when to trade it.
Advanced RS Techniques
RS momentum. Measure the rate of change of the RS ratio over 10-20 days. When RS is both rising and accelerating (positive rate of change), the outperformance is strong and likely to continue.
RS relative to sector. Instead of comparing only to the S&P 500, compare a stock's RS to its own sector. A stock outperforming both its sector and the broad market is doubly strong.
International RS. Compare country ETFs to identify which global markets are leading. Investing in countries with rising RS lines captures international momentum.
RS during market declines. Stocks that hold up the best during market corrections (have rising or flat RS lines while the market falls) are often the first to rally in the recovery and typically outperform over subsequent months.
Relative Strength in Wyckoff Analysis
Wyckoff methodology emphasizes relative strength as a key selection criterion. Wyckoff advised buying stocks that are stronger than the market during accumulation phases and selling stocks that are weaker than the market during distribution phases.
A stock in a Wyckoff accumulation range that maintains a flat or rising RS line while the market declines is showing that the Composite Man is supporting the price — a strong accumulation signal. Conversely, a stock in distribution whose RS line is falling even as the market rises confirms institutional selling.
Building a Relative Strength Watchlist
A systematic RS watchlist approach:
- Weekly review: Calculate RS ratios for all stocks in your universe against the S&P 500
- Identify new leaders: Flag stocks whose RS lines have recently broken to new highs
- Monitor existing leaders: Ensure current holdings maintain strong RS
- Identify deterioration: Flag stocks whose RS lines have broken below rising trendlines
- Sector overlay: Cross-reference individual stock RS with sector RS for confirmation
This disciplined process keeps you focused on the market's strongest names and alerts you when strength begins to fade.
FAQ
How is relative strength different from RSI?
Relative strength compares a stock's performance to a benchmark (like the S&P 500) and shows whether the stock is outperforming or underperforming. RSI measures a single stock's momentum based on its recent gains and losses. RS is a comparative tool for stock selection; RSI is a timing tool for individual stocks.
What is a good relative strength ratio?
The absolute value of the RS ratio is less important than its direction and trend. A rising RS ratio indicates outperformance, regardless of its level. However, stocks in the top 20% of RS rankings across the market have historically produced above-average forward returns.
Can relative strength be used for sector rotation?
Absolutely. Sector RS analysis is one of the most common applications. By comparing each sector's ETF to the S&P 500, you identify leading and lagging sectors and rotate capital accordingly. See our sector rotation guide for detailed implementation.
Does relative strength work in bear markets?
Yes. In bear markets, relative strength identifies stocks and sectors that decline less than the market. These defensive leaders often become the first to rally when the market turns and are strong candidates for early recovery positioning. RS analysis also identifies the weakest names for potential short candidates.
How often should I check relative strength?
Weekly analysis is sufficient for most investors. Active traders may check RS daily to identify emerging leadership or deterioration. The key is consistency — regular RS reviews ensure you stay aligned with market leadership and avoid lagging positions.
Disclaimer
This is educational content, not financial advice. Trading involves risk, and you should consult a qualified financial advisor before making any investment decisions. Past performance does not guarantee future results.
Related Articles
12 chapters covering charts, indicators, risk management & more. Plus weekly trading insights.