Multiple Time Frame Analysis: How Top Traders Use It
⚡ Key Takeaways
- Multiple time frame analysis uses two or three timeframes to align the big picture trend with precise entry timing
- The top-down approach starts with a higher timeframe for trend direction, then drops to a lower timeframe for entries
- A common combination is weekly for trend, daily for setup, and hourly or 4-hour for entry
- Trades that align across multiple timeframes have significantly higher probabilities of success
- Conflicting signals across timeframes are a reason to stand aside and wait for alignment
What Is Multiple Time Frame Analysis?
Multiple time frame analysis is the practice of examining the same stock or market across two or more timeframes to gain a comprehensive view of the price action. Rather than relying on a single chart to make trading decisions, this approach uses different timeframes to understand the trend, identify setups, and time entries.
The concept is straightforward: a stock can look bullish on a 5-minute chart and bearish on a daily chart simultaneously. If you only check one timeframe, you risk trading against a larger, more powerful trend. By checking multiple timeframes, you ensure that your trades are aligned with the dominant market direction.
This technique is used by professional traders across all markets and is considered a foundational skill for consistent profitability.
The Top-Down Approach
The most effective way to implement multiple time frame analysis is the top-down approach. You start with the highest timeframe to identify the macro trend, then work your way down to progressively lower timeframes for setup identification and precise entry timing.
Step 1: Higher Timeframe (The Trend)
The highest timeframe establishes the directional bias. This is the big picture. You are not looking for entries here; you are determining whether you should be looking for long trades, short trades, or neither.
Questions to answer on the higher timeframe:
- Is the stock in an uptrend, downtrend, or range?
- Where are the major support and resistance levels?
- Is the stock near the beginning, middle, or end of a trend?
Step 2: Middle Timeframe (The Setup)
The middle timeframe is where you identify trade setups. This is your primary charting timeframe where you look for patterns, divergences, and opportunities that align with the higher timeframe trend.
Questions to answer on the middle timeframe:
- Is a pullback occurring within the higher timeframe trend?
- Are there recognizable patterns forming (flags, triangles, breakout bases)?
- Do indicators (RSI, MACD) support a potential entry?
Step 3: Lower Timeframe (The Entry)
The lower timeframe is used for precise entry timing. Once the higher timeframe confirms the trend and the middle timeframe shows a setup, you drop to the lower timeframe to find the exact candle to enter on.
Questions to answer on the lower timeframe:
- Is there a bullish or bearish candlestick signal?
- Has price reached a minor support or resistance level?
- Is volume confirming the entry?
Pro Tip
Timeframe Combinations by Trading Style
Different trading styles require different timeframe combinations. The general rule is to use timeframes that are 4 to 6 times apart from each other.
| Trading Style | Higher TF (Trend) | Middle TF (Setup) | Lower TF (Entry) |
|---|---|---|---|
| Scalping | 15-minute | 5-minute | 1-minute |
| Day Trading | Daily | 15-minute | 5-minute |
| Swing Trading | Weekly | Daily | 4-hour |
| Position Trading | Monthly | Weekly | Daily |
These combinations maintain enough separation to give distinct perspectives without jumping so far apart that the analysis becomes disconnected.
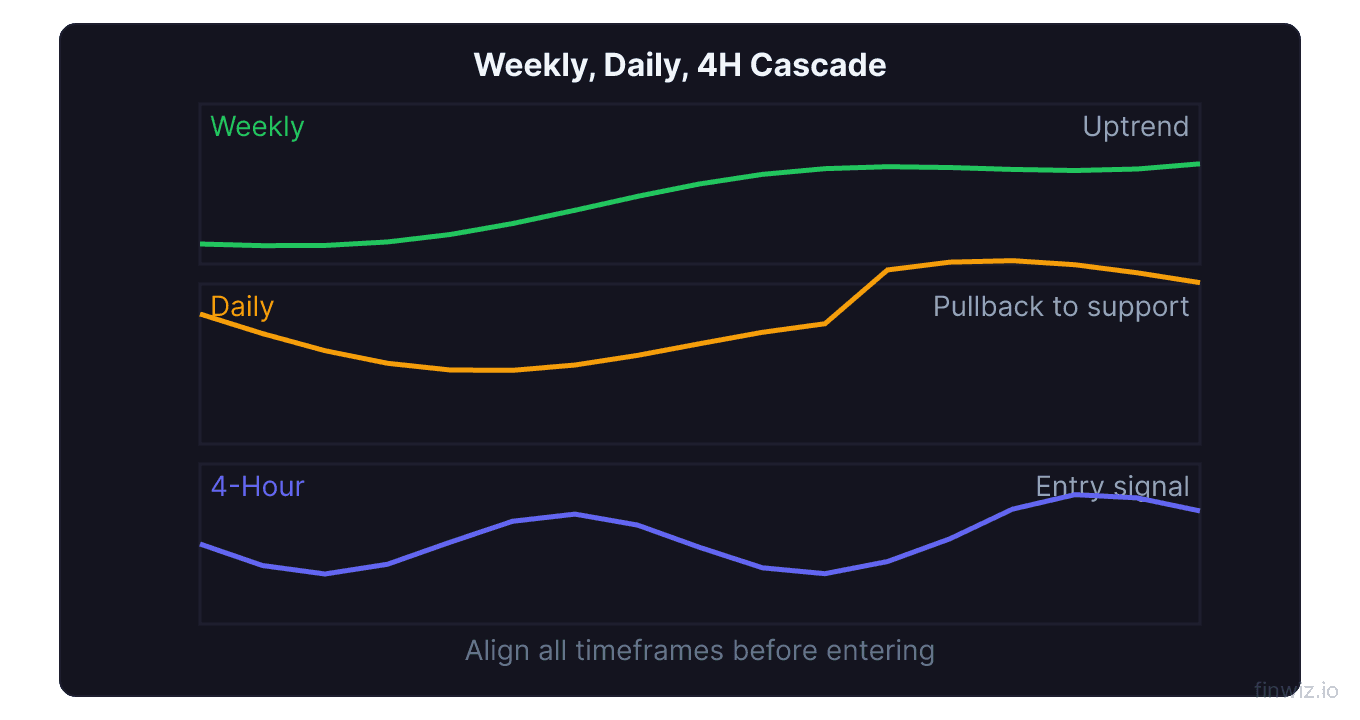
Practical Example: Swing Trade Setup
Let us walk through a complete multiple time frame analysis for a swing trade.
Weekly Chart (Higher Timeframe)
You examine the weekly chart and observe:
- The stock has been in a clear uptrend for six months, making higher highs and higher lows
- Price recently pulled back from a swing high to the 20-week moving average
- The RSI is at 50, neutral, not overbought
- Major support is visible at a clear horizontal level below the current price
Conclusion: The trend is up. You should be looking for buying opportunities.
Daily Chart (Middle Timeframe)
Switching to the daily chart, you observe:
- The stock has pulled back for eight days in a tight, orderly manner
- Volume has declined during the pullback, suggesting sellers lack conviction
- The stock is now sitting at the 50-day moving average, which has acted as support three times previously
- A bullish divergence is forming on the RSI
Conclusion: A potential setup is forming. The pullback is orderly, volume is drying up, and support is nearby.
4-Hour Chart (Lower Timeframe)
Dropping to the 4-hour chart, you observe:
- The stock has formed a small double bottom pattern at the 50-day moving average
- A bullish engulfing candle has formed with a slight uptick in volume
- The short-term downtrend line has been broken
Conclusion: The entry signal has triggered. Enter long with a stop below the double bottom and target the previous swing high on the daily chart.
When Timeframes Conflict
Conflicting signals across timeframes are not a failure of the method; they are valuable information. When timeframes conflict, the best action is usually to wait.
Common conflict scenarios:
Higher timeframe bullish, lower timeframe bearish: The stock is in an uptrend but is currently pulling back. Wait for the pullback to complete and the lower timeframe to turn bullish before entering.
Higher timeframe bearish, lower timeframe bullish: The stock is in a downtrend with a temporary bounce. This is not a buying opportunity. The lower timeframe rally is likely to fail. Consider it a short-selling setup if it reaches resistance on the middle timeframe.
Higher timeframe range-bound: When the higher timeframe shows no clear trend, the middle and lower timeframes will likely produce choppy, unreliable signals. Either trade the range boundaries or find a different stock.
Aligning Indicators Across Timeframes
You can apply the same indicators across multiple timeframes for confluence:
- If the RSI is oversold on both the daily and 4-hour charts, the bullish signal is stronger
- If a moving average is providing support on the weekly chart and the daily chart simultaneously, that level is more significant
- If MACD is bullish on both the middle and lower timeframes, the momentum is aligned
The more elements that align across timeframes, the higher the probability of a successful trade.
Common Mistakes in Multiple Time Frame Analysis
- Checking too many timeframes: Two to three timeframes is ideal. Checking five or six creates confusion and analysis paralysis.
- Giving equal weight to all timeframes: The higher timeframe always takes precedence. Never trade against the higher timeframe trend based on a lower timeframe signal.
- Using timeframes too close together: A 5-minute and 10-minute chart will show nearly identical information. Maintain proper separation (4-6x) between timeframes.
- Anchoring to one timeframe: Some traders identify a setup on their middle timeframe and then search for confirmation on other timeframes. This is confirmation bias. Start with the higher timeframe and work down.
- Not updating analysis: Trends change. Revisit your higher timeframe analysis regularly to ensure your directional bias is still valid.
Building a Multi-Timeframe Routine
Create a consistent routine for your multiple time frame analysis:
- Weekly review: Every weekend, review weekly charts of your watchlist stocks. Mark major trends and key levels.
- Daily review: Each evening, review daily charts for setups that align with your weekly analysis. Identify specific patterns and indicator readings.
- Pre-market review: Before the open, check your lower timeframe for entry signals on stocks with daily setups.
- Intraday monitoring: During the session, monitor your lower timeframe for precise entry and exit timing on identified setups.
This structured approach ensures you always know the big picture before drilling into details.
Frequently Asked Questions
How many timeframes should I use?
Two to three timeframes is optimal. One for the trend, one for the setup, and optionally one for precise entry timing. Using more than three timeframes adds complexity without meaningfully improving your analysis.
Can I use multiple time frame analysis for day trading?
Absolutely. Day traders commonly use the daily chart for the trend, the 15-minute chart for setups, and the 5-minute chart for entries. This ensures intraday trades align with the dominant daily trend.
What if the higher timeframe shows no clear trend?
When the higher timeframe is range-bound, trading becomes more difficult. You can trade the range boundaries (buy at support, sell at resistance) or step aside and wait for a clear trend to develop. Forcing trades in a trendless higher timeframe leads to whipsaw losses.
Should I use the same indicators on each timeframe?
You can, but it is not necessary. Some traders use the same indicators across all timeframes for consistency. Others use trend-following indicators on the higher timeframe (moving averages) and oscillators on the lower timeframe (RSI, MACD) for timing. Both approaches work well.
How do I handle a trade when the higher timeframe trend changes?
If your higher timeframe trend changes while you are in a trade, reassess immediately. If the change invalidates your trade thesis, consider tightening your stop or taking partial profits. If the change is a minor consolidation within a larger trend, you may choose to hold. Always prioritize protecting capital over being right about the direction.
Disclaimer
This is educational content, not financial advice. Trading involves risk, and you should consult a qualified financial advisor before making any investment decisions. Past performance does not guarantee future results.
Related Articles
12 chapters covering charts, indicators, risk management & more. Plus weekly trading insights.